
When Creating 2020 Budgets, Keep in Mind Family Living Costs
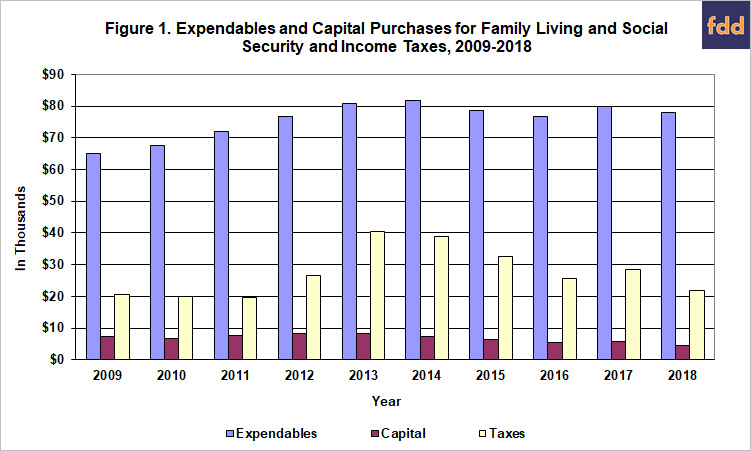
In 2018, the total noncapital living expenses of 1,306 farm families enrolled in the Illinois Farm Business Farm Management Association (FBFM) average was $77,999–or $6,500 a month for each family. This average was 2.3 percent lower than in 2017. Another $4,579 was used to buy capital items such as the personal share of the family automobile, furniture, and household equipment. Thus, the grand total for living expenses averaged $82,578 for 2018 compared with $85,542 for 2017, or a $2,964 decrease per family.
Income and social security tax payments decreased about 23.7 percent in 2018 compared to the year before. The amount of income taxes paid in 2018 averaged $21,692 compared to $28,435 in 2017. Net nonfarm income increased, averaging $44,727 in 2018. Net nonfarm income has increased $10,160, or 29.4 percent in the last ten years.
In Figure 2, total family living expenses (expendables plus capital) are divided by tillable operator acres for 2009 to 2018. In 2009, all of the family living costs per acre averaged about $100 per acre. This increased to $103 per acres in 2018. $109 was the 10-year average of total family living expense per acre. If we compare this to the 10-year average of net farm income per acre of $162, then 67% of the net farm income per acre is family living expense. If we look at the average year over year increase for the last ten years for family living per acre, the annual increase was 0.8% per year. The five-year annual increase per year would average negative 2.9%. Therefore, as you work on your crop budgets, keep in mind that a 51 cent price change on 200 bushels per acre corn is about equal to the average total family living expense per acre.
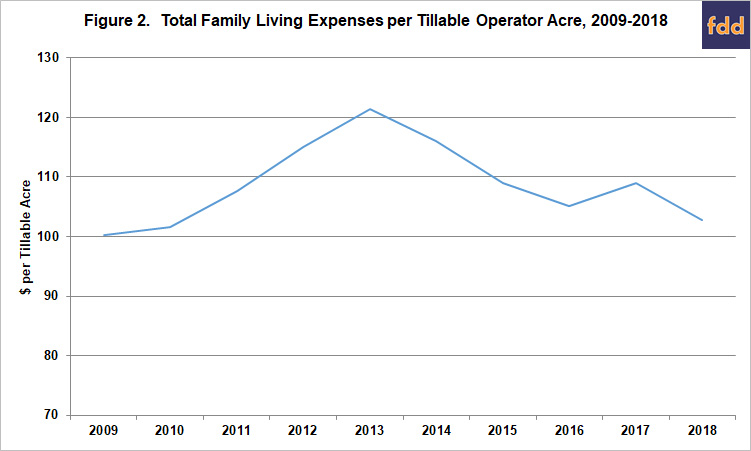
When you take total family living expenses minus net nonfarm income this equals $47 per acre in 2018 and was $55 per acre for the five-year average. This would be the part of family living that is covered by the farm income. In addition, there is another $27 per acre in social security and income taxes to be covered by the farm in 2018. The five-year average for these taxes was $38 per acre. A 24 cent price change on 200 bushels of corn per acre is equal to the 2018 family living cost that would be covered by the farm. If you added the amount of social security and income taxes that would be a 37 cent price change on 200 bushel of corn per acre.
More information about Farm and Family Living Income and Expenditures can be found here: https://farmdoc.illinois.edu/assets/management/whole-farm/FBM-0190familyliving.pdf
The author would like to acknowledge that data used in this study comes from farms across the State of Illinois enrolled in Illinois Farm Business Farm Management (FBFM) Association. Without their cooperation, information as comprehensive and accurate as this would not be available for educational purposes. FBFM, which consists of 5,500 plus farmers and 60 professional field staff, is a not-for-profit organization available to all farm operators in Illinois. FBFM field staff provide on-farm counsel with computerized record keeping, farm financial management, business entity planning and income tax management. For more information, please contact the State Headquarters located at the University of Illinois Department of Agricultural and Consumer Economics at 217-333-8346 or visit the FBFM website at www.fbfm.org.
Source: Bradley Zwilling, Farmdocdaily