
U.S. Agricultural Export Data for the First Ten Months of 2018
Last week, USDA released U.S. agricultural export data that spanned the first ten months of 2018. Although the overall value of exports was higher for this time period compared to 2017, there were reductions in both the value and volume of soybean exports, particularly to China. Business news articles also point to continued adjustments in global commodity markets due to the ongoing U.S., China trade war. Meanwhile, recent news items continue to provide more clarity to U.S., China trade activity stemming from last week’s meeting in Buenos Aires.
USDA Trade Data: January ’18- October ’18
In an update Friday from USDA Radio News, Gary Crawford explained that the Department now has complete U.S. agricultural trade data through October, representing a total of 10 months of trade data for 2018.
From January 2018 through October 2018, U.S. agricultural exports totaled $116.2 billion. USDA trade analyst Bryce Cooke pointed out that this was a four percent increase “from the first ten months of 2017.”
Despite the aggregate increase in U.S. agricultural exports, the value of U.S. soybean and wheat exports were down by ten percent and sixteen percent, respectively.

“U.S. Agricultural Exports, Year-to-Date and Current Months,” USDA- Economic Research Service. (December 7, 2018 – https://goo.gl/xgRFim).
Nonetheless, the value of U.S. corn exports was up thirty-four percent from the same period last year.
With respect to volume, USDA data from last week indicated that, compared to the same time last year, corn export volumes were up by thirty percent.
And from the January 2018 through October 2018 window, the volume of wheat exports had decreased by twenty-three percent, the volume of sorghum exports had fallen by seventeen percent, and soybean volumes were off by six percent.

“U.S. Agricultural Exports, Year-to-Date and Current Months,” USDA- Economic Research Service. (December 7, 2018 – https://goo.gl/xgRFim).
More narrowly, Mexico, Japan, South Korea, and Colombia continue to be among the top destinations for U.S. corn exports. Egypt also purchased significantly more U.S. corn in October (275,000 metric tons) compared to last October (zero).

“Top Ten U.S. Export Markets for Corn,” USDA- Economic Research Service. (December 7, 2018 – https://goo.gl/xgRFim).
In a separate USDA radio update from Friday, USDA’s Bryce Cooke pointed out that the October 2018 monthly U.S. agricultural export number was the lowest since 2011.
The low total is attributed to a significant reduction in soybean exports. Mr. Cooke pointed out that this October soybeans represented sixteen percent of total U.S. agricultural exports, but “for the five previous Octobers, that average was twenty-nine percent.”
The USDA table below demonstrates the sharp reduction in the soybean export volume to China for October 2018 (272,000 tons) versus October 2017 (over 7 million tons).

“Top Ten U.S. Export Markets for Soybeans,” USDA- Economic Research Service. (December 7, 2018 – https://goo.gl/xgRFim).
The USDA’s World Agricultural Outlook Board will be updating its monthly supply and demand forecast for soybeans on Tuesday.

 Farm Policy@FarmPolicy

“Reduced Exports to China in Fiscal Year 2019 May Drive U.S. Agricultural Trade Balance to Lowest Level Since 2007,” by Alex Melton and Bryce Cooke. USDA- Economic Research Service. Amber Waves (December 3, 2018).
“At the regional level, exports to East Asian countries are forecast to decline by $6.7 billion—the result of an expected decrease of $7.3 billion in agricultural exports to China from the 2018 total of $16.3 billion. Chinese demand for U.S. soybeans is expected to drop sharply because of China’s retaliatory tariffs, which also curb demand for other products, including sorghum, pork and products, and dairy.”
Global Soybean Markets
Reuters writer Dominique Patton reported Friday that, “China imported 5.38 million tonnes of soybeans in November, down 38 percent from a year ago and the lowest monthly number in two years, customs data showed on Saturday, after buyers avoided U.S. soybeans amid a tariff war with the United States.”
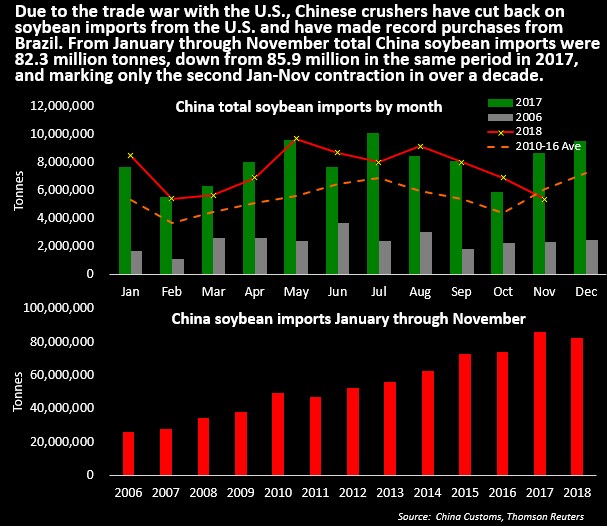
China soybean imports over time and for Jan-Nov 2018. “China November soybean imports plunge 38 percent year-on-year on tariff war,” by Dominique Patton. Reuters News (December 7, 2018).
The article added, “There are also forecasts of record soybean production in Brazil, which is due to start its harvest this month.”
And Reuters writer Hugh Bronstein reported late last week that, “Argentine soybean exports to China could jump to a record 14 million tonnes this season if the trade war between China and the United States continues, the Rosario grains exchange said on Thursday, as output rebounds from last year’s drought.
China has all but stopped buying soybeans from the United States. This has driven down the price of U.S. beans. As a result, U.S. soy crushers are shipping to soymeal markets previously supplied by Argentina, which in turn is exporting more raw beans, mainly to China.
More narrowly on this issue, an update late last month from USDA’s Foreign Agricutual Service (FAS), “Argentina- Oilseeds and Products Update: Soybean Imports Continue to Rise Significantly,” stated that, “Following last season’s drought, lower domestic soybean supplies necessitated a dramatic increase in soybean imports for the crush industry. Through September, Argentina imported over 3.5 million tons of soybeans, a 135 percent increase from the same period the previous year.”

“Argentina- Oilseeds and Products Update: Soybean Imports Continue to Rise Significantly,” USDA- Foreign Agricultural Service (November 28, 2018).
The FAS update pointed out that, “Within this total, U.S. soybean exports to Argentina reached nearly 450,000 tons during this same period, with expectations of greater shipments to come in the next few months. According to USDA export sales data, U.S. soybean exports to Argentina should reach about 1.5 million tons within the next few months.”

“Argentina- Oilseeds and Products Update: Soybean Imports Continue to Rise Significantly,” USDA- Foreign Agricultural Service (November 28, 2018).
U.S., China Trade Agreement
Wall Street Journal writers Lingling Wei and Bob Davis reported Sunday that, “A week after President Trump and Chinese leader Xi Jinping struck a trade truce in Buenos Aires, details of the cease-fire are becoming clear—big Chinese purchases, tough negotiations and shifting deadlines to finish a deal.
“Interviews with officials in both countries, briefed on the Trump-Xi talks, give a fuller picture of the agreement the two men reached. The two sides agreed on a negotiating period of about 90 days, during which the U.S. won’t raise tariffs on $200 billion of Chinese goods to 25%, as it had planned to do on Jan. 1.”
“Under the terms of the understanding, purchases and tariff reductions aren’t required until a deal is struck, but both sides believe that early purchases would serve as a kind of down payment and give a boost to negotiations. Beijing wants to convince the U.S. to roll back tariffs on Chinese goods,” the Journal article said.
Source: Farm Policy News