Farm Economy-Debt to Income Signals Caution
Over the last few years we have documented a number of important trends in the financial condition of the U.S. farm sector. These have included a decline in liquidity, rapidly growing amounts of real estate debt, and deteriorating repayment capacity. While falling interest rates have helped to mitigate the impact of increased debt use, farm income has often been soft. This week we look at the relationship between farm income and debt levels.
Total Farm Debt Just Short of Record Levels
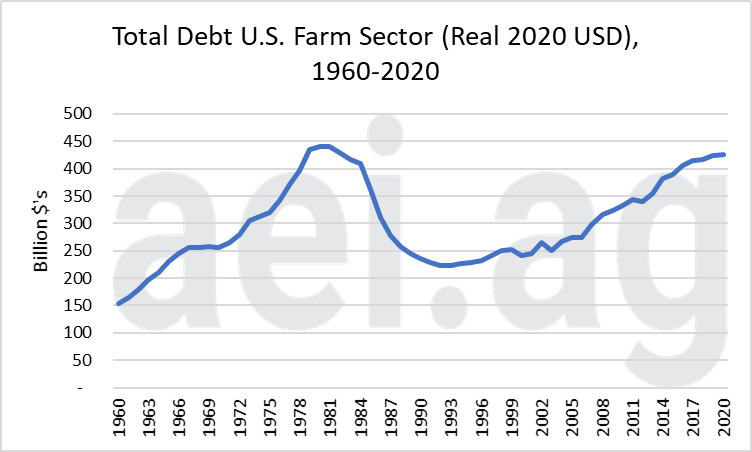
The total amount of debt in the farm sector has increased rapidly in recent years. Figure 1 shows the total amount of debt in the farm sector measured in real 2020 USD. Today, total debt stands at $425 billion dollars, just short of the 1981 peak of $440 billion. The annual increase from 2000 to 2020 has been achieved through the relatively consistent small increases in debt, as opposed to a rapid run-up. For instance, from 2000 to 2020 the average annual increase has been a relatively modest 3%, compared to the 5% annual increase experienced from 1970-1981.

Figure 1. Total Farm Debt, U.S. Farm Sector (Real 2020 USD), 1960-2020.
Real Estate Debt at All-Time Highs
The interesting thing about debt levels is that most of the growth has been in the form of real estate debt (Figure 2). At $264 billion dollars, real estate debt is well beyond any levels seen in history. Since 2000, real estate debt has grown at an average annual rate of 4% per year. This has caused real estate debt to more than double over that time period.

Figure 2. Total Real Estate and Non-Real Estate Debt, U.S. Farm Sector 1963-2020.
Putting Debt Levels into Perspective
There are a variety of ways to measure the amount of debt in the farm sector, but it is usually most interesting to compare it to the level of other values, such as assets or income. While the debt-to-equity and debt-to-asset ratios are probably the most commonly reported measures of relative indebtedness, we feel that it is often more useful to look at debt relative to income-based measures.
Ratios including income or cash flow put debt in the context of the earnings generated by the sector. At the end of the day, it is earnings and cash flow that will normally be used to repay debt. The downside of using ratios of earnings to debt is that they tend to be much more volatile than purely balance sheet measures. This is because earnings generally fluctuate more than asset values. With that said, let’s take a look at how net cash income compares to total debt in the farm sector.
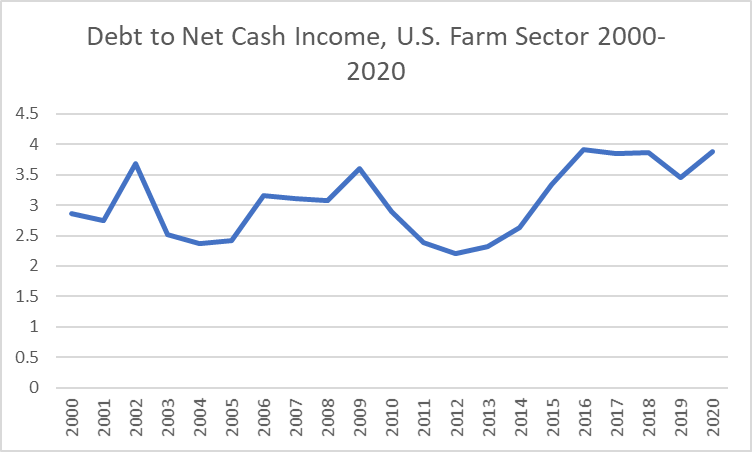
Figure 3 shows the ratio of total debt to net cash income for the farm sector. At present, debt checks in at 3.88 times net cash income. This is at the top end of the range seen in the last 20 years. The ratio fell rapidly in the farm income boom period and then rose rapidly until 2016. Since 2016 it has remained in an elevated state as incomes have rebounded along with increases in debt levels.

Figure 3. Debt to Net Cash Income for the U.S. Farm Sector, 2000-2020.
Historical Context
The question is whether this represents a level that is 1) sustainable, 2) has room for continued growth, or 3) too high. If one were to consider a longer history – that included the financial turmoil of the 1980’s- this level of debt to net cash income is low. During that period of time, the debt to cash income ratio peaked at 5.6 in 1981. While the current ratio is considerably lower today, we find little comfort in that fact. Clearly, when the ratio reached those levels it was unsustainable. In other words, we don’t want to go to those levels.
Looking back across time, the only period that this ratio has been consistently above 4.0 was from 1976-1984, which was the income run-up and fall from the 1981 peak. It is true that interest rates are very low at present. This helps to reduce the interest portion of debt service and would suggest that the sector can carry more debt than it could say 20 years ago. Still, one must question whether the sector can comfortably handle much additional debt service at present levels of income.
Wrapping it Up
Although there have been many stories of increased farm bankruptcies, we must also consider the fact that the current level of debt to cash income has not resulted in what we would categorize as widespread financial distress. For instance, the rate of farm bankruptcies, while increasing, is nowhere near the levels observed in the 1980s. This would suggest that perhaps the current level of debt to income is acceptable going forward.
On the negative side of that ledger, one must consider that a substantial portion of net cash farm income in the last few years has come in the form of government program payments. The troubling part of this fact is that many of the dollars have flowed from ad hoc program payments, such as the market facilitation program (MFP). These dollars have to be considered more uncertain than those that would arise from payments made under the traditional farm program.
At present, it would seem that the current levels are sustainable, but with little room for further growth. The current level of debt to net cash income is risky territory for the farm sector. While it is quite likely that the sector will navigate through this territory with few problems, it also removes some of the room for error. For instance, had the government not authorized the last two rounds of MFP programs, the financial condition in the farm sector would be much, much worse.
Any further drops in income would potentially move conditions to an area where debt service becomes burdensome. It is also true that bad outcomes are by no means a foregone conclusion. Things could and probably will most likely turn out alright. However, should the ratio continues to deteriorate, much more serious attention should be paid to the farm financial situation. Any deterioration in income would push us toward the conclusion that debt is approaching levels that should be viewed as too high.
Click here to subscribe to AEI’s Weekly Insights email and receive our free, in-depth articles in your inbox every Monday morning.
You can also click here to visit the archive of articles – hundreds of them – and to browse by topic. We hope you will continue the conversation with us on Twitter and Facebook.
Source: Brent Gloy, Agricultural Economic Insights

