
Cost and Returns from Different Nitrogen Application Timing in Illinois
Overall returns on Illinois grain farms are projected to be much lower in 2019 than recent years, resulting in more consumer about managing input costs. Fertilizer, seed, and pesticide costs represent a large portion of the total cost of producing corn, with fertilizer costs historically larger than seed and pesticide per-acre costs on high-productivity farmland in central Illinois. This article explores the timing of different nitrogen applications used on central Illinois corn fields and the average cost, returns, products applied, and application rate of nitrogen. Precision Conservation Management (PCM) data suggest splitting nitrogen applications may provide comparable or greater operator and land returns to fall nitrogen application. Fields with 40% or more of total nitrogen applied in the fall had a higher yield compared to some split nitrogen applications, but the average nitrogen application rate and nitrogen cost are higher for the mostly fall applied nitrogen fields, which is mainly due to the cost of nitrogen stabilizer, reducing the average operator and land return below most split applications.
Nitrogen timing and application rates can also have important implications for water quality. Nutrient losses from agricultural fields have become a high-profile water quality issue since the release of the 2015 Illinois Nutrient Loss Reduction Strategy which determined that 80% of the nitrate-N leaving Illinois through our major rivers originates from agricultural fields. Nitrate losses from agricultural fields can contaminate local drinking water supplies, forcing local municipal water treatment facilities to upgrade their water treatment equipment. Increased nitrate levels have also been shown to increase the area of the hypoxic zone further downstream in the Gulf of Mexico, impairing waters for aquatic organisms living there.
Precision Conservation Management (PCM)
We summarize data from corn production on farmland in central Illinois for the years of 2015 to 2018. PCM is a farmer service program led by the Illinois Corn Growers Association in partnership with over 30 entities including other commodity associations, conservation groups, private foundations, supply chain providers, the Soil and Water Conservation Districts, and the Natural Resource Conservation Service (NRCS). In an effort to address the goals of the Illinois Nutrient Loss Reduction Strategy, the mission of PCM is to help farmers make decisions about adopting on-farm conservation practices in a financially responsible way. Through PCM’s regional specialists, PCM works one-on-one with nearly 300 farmers enrolled in its 16-county service area, representing over 200,000 acres of Illinois farmland.
For this article, PCM provided aggregated farmer data to further explore the economics of nitrogen applications on 1,664 central Illinois corn fields, with 64% of the fields classified as high productivity soil (above 130 Soil Productivity Index). For each field in PCM, the farmer indicated all their field passes, as well as input usage. Yields and moisture levels also were included. These data were used to develop an economic analysis of each field. This report included:
- Revenue from crop sales. The field’s yield was multiplied by a standard yearly price the same across all farms.
- Direct costs. Direct costs included seed, fertilizer, pesticides, drying, storage, and crop insurance. Actual input amounts recorded by each farmer were multiplied by a standard input price the same across all farmers.
- Power costs. Each field pass was assigned a cost based on Machinery Cost Estimates from the University of Illinois based on the farmer’s actual implement and a general tractor cost. The sum of all these field pass costs represented machinery-related power costs.
- Overhead costs. Overhead costs were based on Illinois Farm Business Farm Management Association (FBFM) data and the same for all farms.
These economic reports resulted in operator and land returns, a measure of return for farmland. Operator and land return does not include a cost for land. Subtracting off a land cost, such as cash rent, would give a farmer net return. Operator and land returns are summarized across nitrogen classifications in the following sections.
Nitrogen Benchmark Classes
Each field raising corn is classified by a nitrogen benchmark based on the timing of the nitrogen application. This benchmark is characterized into the following classes
- Mostly fall – more than 40% of nitrogen is applied in the fall.
- Mostly pre-plant – the majority of nitrogen is applied in spring prior to planting.
- 3-way split – nitrogen is roughly evenly split across three nitrogen applications.
- 50% pre-plant/50% sidedress – roughly half the nitrogen is applied prior to planting and 50% is applied after planting.
- Mostly sidedress – most of the nitrogen is applied after planting.
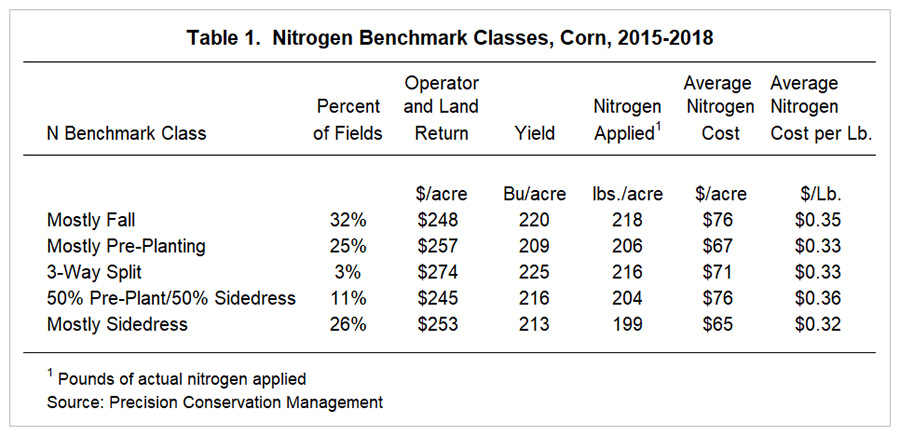
Table 1 shows the percentage of fields, average operator and land return, average yield, average nitrogen rate, average per-acre nitrogen cost, and average per-pound nitrogen cost by nitrogen benchmark class for fields planted in corn from 2015-2018. The average per-acre and per-pound nitrogen cost includes the cost of nitrogen stabilizers for farmers who used stabilizers. Most fields are categorized as the mostly fall applied nitrogen class. The mostly fall applied nitrogen class had the highest average nitrogen application rate and is tied for the highest nitrogen cost. The 3-way split class had the highest yield at 225 bushels per acre and the highest returns at $274 per acre. The average operator and land returns for the split nitrogen application classes are higher or comparable to the mostly fall nitrogen application class.
Nitrogen Stabilizers
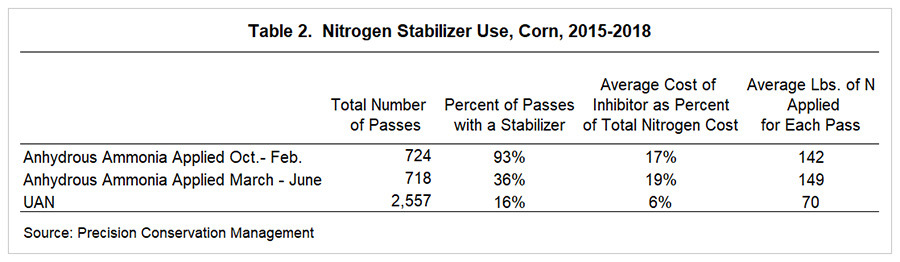
Many farmers applied a nitrogen stabilizer with their anhydrous ammonia or UAN. This increases the cost of nitrogen application, particularly when applying anhydrous ammonia. Table 2 shows the percentage of field passes for anhydrous ammonia applied from October to February, anhydrous ammonia applied March to June, and UAN where a nitrogen stabilizer was applied. The third column displays the average cost of the nitrogen stabilizer as a percentage of total nitrogen cost for each field. The analysis factors in an average anhydrous ammonia stabilizer cost of $13 per acre and a UAN stabilizer cost of $4 per acre. On average, the cost of an anhydrous ammonia nitrogen stabilizer makes up a larger portion of the total nitrogen cost, which is the main reason the cost of fall nitrogen application is higher than split applications. The majority (93%) of farmers applying fall anhydrous use a nitrification inhibitor with the application. Nitrapyrin-containing stabilizers such as N-Serve have been shown to reduce nitrification and, thus, should reduce nitrate-N losses through leaching although studies conducted in Illinois in fall 2015/spring 2016 indicated a high degree of variability in the percentage of nitrate recovered in spring following use of N-Serve (Nafziger, 2017). Nevertheless, using a N stabilizer on fall-applied N fertilizer is considered important for good fertilizer stewardship and protecting local drinking water supplies.
Nitrogen Products Applied
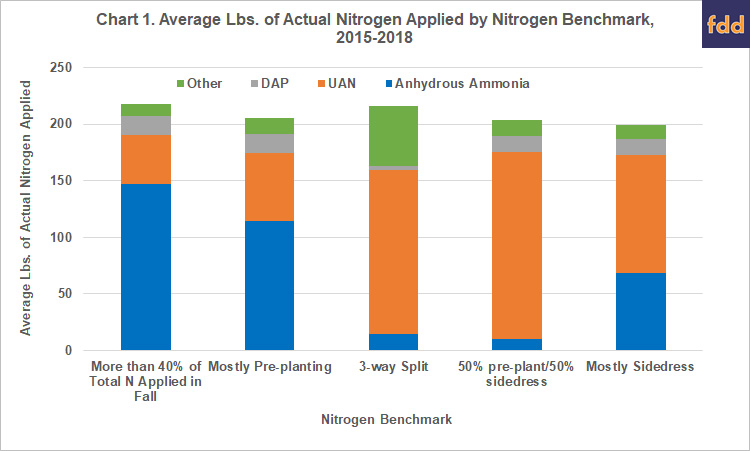
The most commonly applied nitrogen products from the PCM dataset on central Illinois corn fields are anhydrous ammonia, UAN 28%, and UAN 32%. Other products applied include urea, custom dry fertilizer, custom liquid fertilizer, DAP, MAP, and AMS. Chart 1 displays the average pounds of nitrogen applied by nitrogen benchmark class. Each bar on the chart displays the average pounds of each product applied within each benchmark class. Anhydrous ammonia is the product most often applied in the fall application class and mostly pre-planting nitrogen class. For the 3-way split, 50% pre-plant/50% sidedress, and mostly sidedress benchmark classes, the most commonly applied product is UAN. Of the 2,557 UAN field passes in the data, 58% of the passes are UAN 28% and 42% of the passes are UAN 32%.
Summary
Farmers in central Illinois apply a variety of nitrogen products, with the most-often applied products being anhydrous ammonia, UAN 28%, and UAN 32%. On average, farmers who apply 40% or more of their nitrogen in the fall had the second highest yield but lower returns compared to other nitrogen management classes. The lower returns for fall nitrogen application can mainly be attributed to the cost of a nitrification inhibitor for anhydrous ammonia applications. On average, the other post-fall nitrogen applications provided equally as high or higher operator and land return compared to fall application.
Acknowledgements
The authors would like to acknowledge that data used in this study was generated from the Precision Conservation Management (PCM) program, a farmer service program led by the Illinois Corn Growers Association. PCM is currently enrolling farmers in Champaign, Christian, DeWitt, Douglas, Edgar, Ford, Livingston, Macon, Macoupin, McLean, Piatt, Sangamon, Tazewell, Vermilion, and Woodford counties. For more information, please contact PCM by email at info@precisonconservation.org, or visit the PCM website at www.precisionconservation.org.
References
Nafziger, E. “Spring Nitrogen Management.” Bulletin, Department of Crop Sciences, Integrated Pest Management at the University of Illinois, April 13, 2017. http://bulletin.ipm.illinois.edu/?p=3854
Schnitkey, G. “Historic Fertilizer, Seed, and Chemical Costs with 2019 Projections.” farmdoc daily (8):102, Department of Agricultural and Consumer Economics, University of Illinois at Urbana-Champaign, June 5, 2018.
Schnitkey, G. and L. Gentry. “The Economic Advisability of Lowering 2019 Nitrogen Application Rates on Corn.” Farmdoc daily (9):48, Department of Agricultural and Consumer Economics, University of Illinois at Urbana-Champaign, March 19, 2019.
Schnitkey, G. and K. Swanson. “Release of 2020 Crop Budgets, Revised 2019 Budgets, and Up-dated Revenues and Costs.” Farmdoc daily (9):130, Department of Agricultural and Consumer Economics, University of Illinois at Urbana-Champaign, July 16, 2019.
Source: Sarah Sellars, Gary Schnitkey, Dale Lattz and Laura Gentry, Farmdocdaily