Big Expectations for Corn and Soybean Usage
The following is a condensed version of an AEI Premium article published in early July. Not a subscriber yet? You can access the full story – and much more – by starting a free trial here.
There’s been a lot of chatter about the pace of corn and soybean export sales activity for the 2020/21 marketing year. This is certainly good news. While most excitement has centered around China’s purchases of corn and soybeans, it is important to step back and consider the context of this activity. This week’s post reviews the USDA’s usage estimates for the 2020/21 marketing year and usage activity in recent years.
Corn
It can be difficult to stay up-to-date on usage. There is bottom-line total usage, but also several categories. One category is higher, another lower, but what’s the overall story? To help, figure 1 plots overall annual usage since 2017/18, along with yearly changes by category. While the estimates for 2019/20 and 2020/21 are far from final, they provide a few key insights.
First, corn usage peaked during the 2017/18 marketing year at nearly 14.8 billion bushels. For the current marketing year (2019/20), usage is down 8% from the highs. While ethanol and the complete unwinding of U.S. gasoline consumption have been the big story in recent months (ethanol usage down 528 million bushels), ethanol’s headaches started long before COVID as usage slumped 227 million bushels between 2017/18 and 2018/19.
Second, corn’s challenges were not limited to ethanol as exports have fallen by 663 million bushels over the last two years.
Finally, consider the USDA’s early estimate for 2020/21 usage. The bottom-line number (14.6 billion) remains below the 2017/18 highs. Second, the sharp rebound comes from improvements across all categories shown. While ethanol (+350m) and exports (+375m) are both improving, both categories remain below the 2017/18 levels.
Of course, the two other questions that come to mind for corn are the small-refinery exemptions (SREs) and activity in feed & residual. Both will be important to monitor during the next 12-18 months.

Figure 1. Trends in Corn Usage, 2017/2018 to Est. 2020/2021. Data Source: USDA WASDE, July 2020.
Soybeans
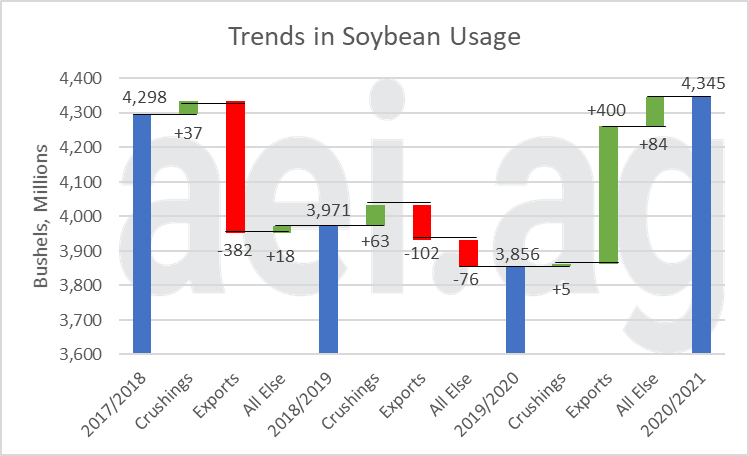
Figure 2 shows the same data for soybean usage. Again, usage peaked at nearly 4.3 billion bushels during the 2017/18 marketing year. For the current marketing year (2019/20), estimated usage reflects a 10% contraction over the last two years. While the decline in soybean usage (-10%) has been larger than corn (-8%), the headaches are mostly export-related. Overall, soybean exports fell 23% (or 484 million bushels) between 2017/18 and 2019/20. That metric will serve as a measure of the impact of the U.S./China trade war and associated export disruptions.
For the 2020/21 marketing year, the USDA is expecting usage to exceed 2017/18 highs and reach 4.35 million bushels. Most of the improvement will come from a sharp uptick in exports, which are estimated at 23% higher than 2019/20 activity. Additionally, exports will be only 4% below 2017/18 levels.

Figure 2. Trends in Soybean Usage, 2017/2018 to Est. 2020/2021. Data Source: USDA WASDE, July 2020.
Wrapping it Up
Sorting through the moving pieces will likely leave you with conflicting conclusions. On the one hand, the estimates for 2020/21 seem a bit optimistic as they represent a sharp increase and undoing of two years of decline. Conversely, the estimates seem reasonable as they are a return to levels reached a couple of years ago. We’ll let you decide which is more appropriate.
There are two points to keep in mind. First, usage has been a significant headwind for corn and soybeans over the last two years. The challenges were not limited to soybeans exports, ethanol, or COVID. What’s particularly challenging is these declines, especially into 2018/19, occurred with large U.S. yields and production.
Second, be careful with the wave of news about an uptick in export activity. While this is good news, a significant increase in export activity – for both corn and soybeans – is already “baked in” to the USDA’s estimates. This will make it challenging to sort out. Is the increased activity sufficient enough to overcome the USDA’s existing estimates? In short, there will be a lot of attention and articles highlighting the increase in usage activity, but we must consider how the ‘good news’ in corn and soybean usage stacks up to the USDA’s already big expectations.
Click here to subscribe to AEI’s Weekly Insights email and receive our free, in-depth articles in your inbox every Monday morning.
Looking for more? AEI Premium provides even more insights and content. It is also where you can challenge your thinking with the Ag Forecast Network (AFN) tool. Start your risk-free trial here.
Source: David Widmar, Agricultural Economic Insights

