Agricultural Conservation on Working Lands-Trends From 2004 to Present
The USDA’s Office of the Chief Economist (OCE) recently released a report title, “Agricultural Conservation on Working Lands: Trends From 2004 to Present.” A fact sheet that accompanied the report explained that, “The first step toward increasing adoption of conservation practices is to establish a baseline of current adoption rates;” and added that the report, “uses survey data to track U.S. adoption of selected agricultural conservation practices that both reduce GHG [green house gas] emissions and provide additional environmental benefits.” Today’s update includes brief excerpts and highlights from both the report and fact sheet.
Contributors to the OCE report included: Marci Baranski, Helena Caswell, Roger Claassen, Charlotte Cherry, Kirsten Jaglo, Alex Lataille, Sharon Pailler, Diana Pape, Anne Riddle, Drew Stilson, and Kate Zook.
Background
The authors explained that, “Tracking every conservation practice is beyond the scope of this report; as a result, the scope was narrowed to track a subset of working-lands conservation practices producing a common benefit: reduced GHG emissions or increased carbon sequestration. Specifically, we included practices that were targeted as part of USDA’s Building Blocks for Climate- Smart Agriculture and Forestry initiative and narrowed those to practices for which survey data were available. Such practices include reduced tillage (mulch tillage and no tillage), nitrogen management, use of cover crops, use of precision agriculture technologies, and use of anaerobic digesters for manure, which generate GHG benefits by reducing emissions of nitrous oxide, methane, carbon dioxide, and/or increasing carbon sequestration.”
The report stated that, “Application of nitrogen fertilizers to soils is the largest source of GHG emissions in agriculture. In 2015, it accounted for approximately 75 percent of N2O emissions and 3.8 percent of total emissions in the United States.”
“Corn had the highest nitrogen per acre application rate and the highest percentage of applied acres of the three crops studied,” the report said. (Soybeans and wheat were the other crops reviewed in the report).
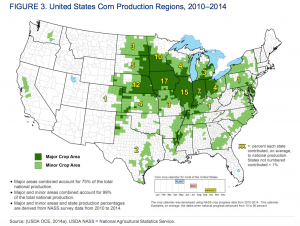
With respect to corn acres in the U.S., the OCE update pointed out that, “Based on ARMS data, 77.2 million acres of corn were planted in 2005, 81.9 million acres were planted in 2010, and 86.9 million acres were planted in 2016. The regions with the highest acreage were the Corn Belt, the Northern Plains, and the Lake States.”
Baranski, M., Caswell, H., Claassen, R., Cherry, C., Jaglo, K., Lataille, A., Pailler, S., Pape, D., Riddle, A., Stilson, D. and Zook, K., 2018. Agricultural Conservation on Working Lands: Trends From 2004 to Present. Technical Bulletin Number 1950. Office of the Chief Economist, U.S. Department of Agriculture, Washington, D.C. 127 pages. November 2018.
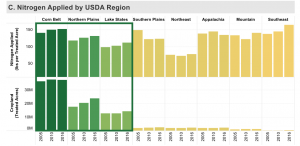
More narrowly, the authors noted that, “On corn acres where nitrogen was applied, mean application rates increased between 2005, 2010 and 2016 in the three major production regions.” (See graph below).
Baranski, M., Caswell, H., Claassen, R., Cherry, C., Jaglo, K., Lataille, A., Pailler, S., Pape, D., Riddle, A., Stilson, D. and Zook, K., 2018. Agricultural Conservation on Working Lands: Trends From 2004 to Present. Technical Bulletin Number 1950. Office of the Chief Economist, U.S. Department of Agriculture, Washington, D.C. 127 pages. November 2018.
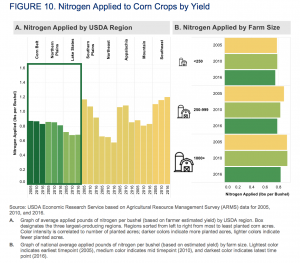
“For nitrogen per bushel, mean application rates decreased between 2005 and 2016 in the three major production regions.” (See graph below).
Baranski, M., Caswell, H., Claassen, R., Cherry, C., Jaglo, K., Lataille, A., Pailler, S., Pape, D., Riddle, A., Stilson, D. and Zook, K., 2018. Agricultural Conservation on Working Lands: Trends From 2004 to Present. Technical Bulletin Number 1950. Office of the Chief Economist, U.S. Department of Agriculture, Washington, D.C. 127 pages. November 2018.
Precision Agriculture
The OCE update noted that, “Precision agriculture includes the use of various technologies, such as tractor guidance systems using a global positioning system (GPS), GPS soil sampling, and GPS yield mapping. These technologies help farms gather information on field conditions and site-specific within-field limitations and allow for adjustments to production practices, such as variable-rate technology (VRT) for the application of inputs (fertilizer, seeds, irrigation water, pesticides). Potential benefits of precision agriculture include reduced inputs resulting in cost reductions, more efficient use of production inputs, and significant environmental benefits such as improved soil and water quality and reduced GHG emissions.”
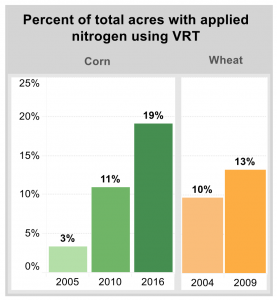
The OCE fact sheet explained that, “The percentage of acres grown using variable rate technology (VRT) for nitrogen application increased for both corn and wheat production at the National level.” (See graph below).
USDA Fact Sheet: Agricultural Conservation on Working Lands: Trends From 2004 to Present (November 2018).
Cover Crops
The authors pointed out that, “Cover crops are not harvested and are typically grown either during fallow periods (when harvested crops are not grown) or grown simultaneously with main crops (such as in an orchard or vineyard, called intercropping).”
Cover crops can also reduce GHG emissions and provide energy and cost savings by adding nitrogen to the system and increasing availability of soil nutrients, thereby reducing the need to apply fertilizer.
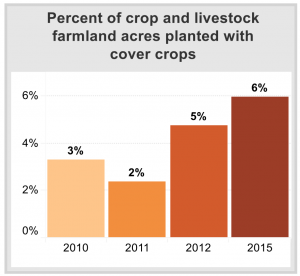
According to the USDA fact sheet, “The percent of crop and livestock farmland acres grown with cover crops increased at the National level.” (See graph below).
USDA Fact Sheet: Agricultural Conservation on Working Lands: Trends From 2004 to Present (November 2018).
Tillage
The OCE report stated that, “The more disruptive or intense the tillage, the higher the likelihood of soil erosion, nutrient runoff into nearby waterways, and the release of GHGs. A strong correlation exists between tillage intensity (i.e., amount of soil disturbed) and the amount of soil organic carbon lost to the atmosphere as carbon dioxide.”
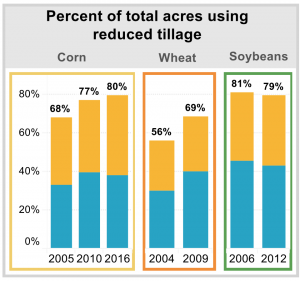
With respect to this variable, the fact sheet stated that, “The blue bars show the percent of acres grown using no- till [least intensive form of tillage] and the orange bars show percent of acres grown using mulch till [higher tillage rating than no-till, but lower intensity of tillage than conventional tillage]. The percent of acres grown using conservation tillage (combined no till and mulch till) showed slight increases for corn and wheat and remained constant for soybean production at the National level.” (See graph below).
USDA Fact Sheet: Agricultural Conservation on Working Lands: Trends From 2004 to Present (November 2018).
Digesters
The November OCE report indicated that, “When stored or treated in anaerobic conditions (without oxygen), livestock manure decomposes to produce biogases. Biogases are comprised of between 60 and 80 percent methane (CH4) which is both a potential energy source and a potent greenhouse gas. In 2015, most of the emissions from livestock manure, 66.3 million metric tons of CO2 equivalent, came from anaerobic decomposition. Anaerobic digester systems can reduce biogas (and methane emissions) by capturing the emitted gases and using them to generate electricity and/or heat or converting them to CO2.”
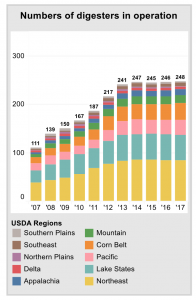
The accompanying USDA fact sheet stated that, “While the cumulative number of digesters in operation increased from 2007 to 2017, the rate of increase slowed between 2013 to 2017. Most digesters in operation during this period were in the Northeast and Lake States Regions. Digesters are more common on relatively large farms compared to small farms, and are more prevalent on dairy operations compared to beef and swine operations.” (See graph below).
USDA Fact Sheet: Agricultural Conservation on Working Lands: Trends From 2004 to Present (November 2018).
Conclusions
“Practices that increased over time include precision agriculture and use of cover crops,” the report said. The OCE update added that, “The data for cover crops showed increased use over time, but overall had very low adoption rates.”
The report also noted that, “Trends in the use of reduced tillage varied by specific crop and tillage type. The proportion of acres grown using no tillage showed the greatest increase for wheat (from 22 percent in 2004 to 41 percent in 2009), increased slightly for corn (from 29 percent in 2005 to 33 percent in 2016) and decreased slightly for soybeans (at 47 percent in 2006 and 44 percent in 2012) based on ARMS data.” Source: Keith Good, Farm Policy News


