
A Brief Look at Spring Flooding Variables
Bloomberg writer Brian K Sullivan reported on Friday that, “For the second year in a row, much of the U.S. is primed to suffer multi-billion dollar flood losses, with farmers already steeling themselves for planting delays.
“Relentless storms that have marched across the Midwest and into the South this winter have already filled rivers to the brim and are threatening to make farm fields too soggy to plant as spring arrives. And there isn’t much to suggest an easing ahead. Heavy rains forecast through next week could push waterways higher where the Mississippi and Ohio meet in Illinois, and into northern Mississippi and Arkansas.

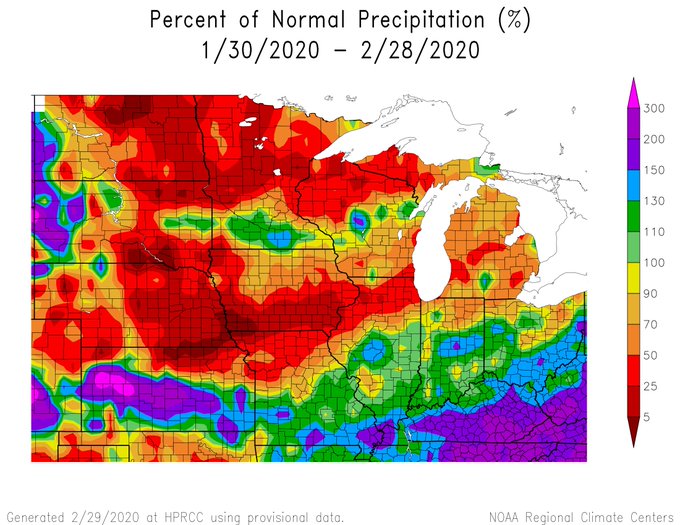
“Most states in the American heartland have had two to three times more moisture than normal so far this winter, according to the National Centers for Environmental Information. As February ends and the rains of March and April approach, it won’t take much to cause major problems for farmers in the planting season, homeowners and businesses.”

The Bloomberg article stated that, “‘Odds are we won’t have the $20 billion in losses we had last year,’ said Jeff Masters, a meteorologist with Scientific American in Ann Arbor, Michigan. ‘But the odds are we will see multi-billion dollar losses.’


Meanwhile, the North Central River Forecast Center (NCRFC ) Spring Hydrologic Outlook noted in February that, “There continues to be a significantly elevated chance of flooding in the Upper Mississippi River drainage area and the Hudson Bay drainage, particularly the Red River of the North basin. Overall, 103 forecast points show a 50 percent or greater chance of moderate to major flooding within the next three months (a slight increase from the initial outlook). The greatest concentration of flood risk remains along the Mississippi River and Red River of the North. Tributaries to these basins continue to have a significantly elevated flood risk. While the flood risk in the Great Lakes drainage basins continues to remain elevated, it is mostly of potential minor to moderate flooding.

Farm Policy@FarmPolicy
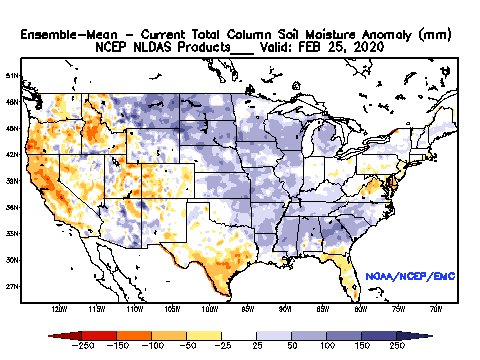
Soil Moisture
* Dakotas much wetter than last year.
* Eastern #corn belt drier, but not dry.
(Central Region Climate & #Drought Outlook February 20, 2020, http://bit.ly/2HWfjWU by @Trent_W_Ford).
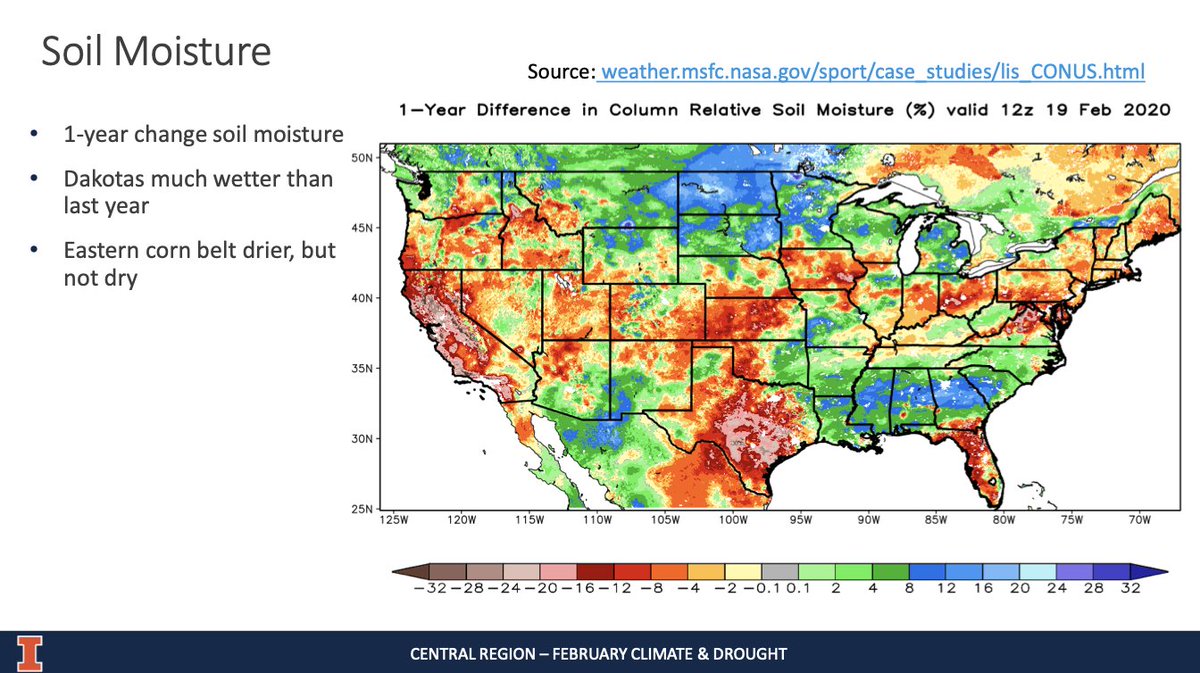
“With the well above normal rainfall during last calendar year (125 to 150% of normal), soil conditions have remained saturated below the cover of the snowpack over the fall and winter months. Soil wetness remains in the 95th to 99th percentile over all of the NCRFC area.”

And the Missouri Basin, Pleasant Hill River Forecast Center indicated last week that, “Flood risk this Spring is above normal for much of the Missouri River basin this year. The largest departure from normal flood risk exists in the eastern portion of the basin, where chances for flooding are anywhere from 10 percent to as much as 70 percent greater than normal. The area of very much increased risk includes eastern North Dakota, eastern South Dakota, eastern Nebraska, western Iowa, eastern Kansas and across the state of Missouri.”

Dennis Todey@dennistodey · Feb 29, 2020
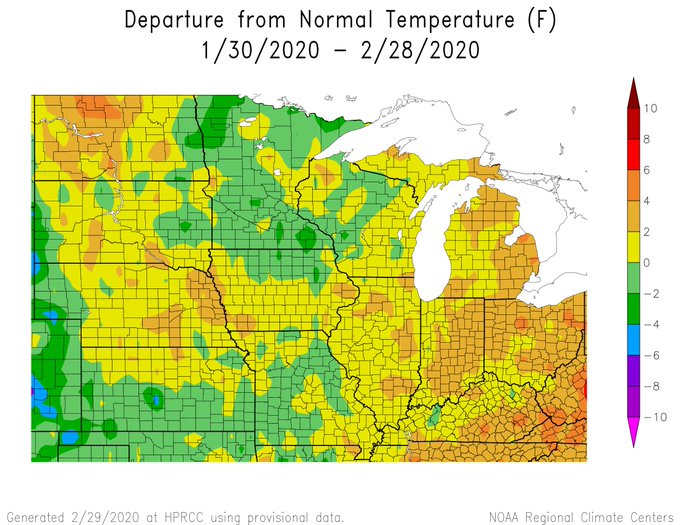
@NWSCPC Week 2 and Week 3-4 right now are warm for most of the eastern part of the US. This will help drying of soil surfaces and warming soils more quickly than last year. (2/x)

Dennis Todey@dennistodey
Tougher call on precip. Dry currently. Likely getting wetter again Great Lakes week 2 and northern areas week 3. I would keep a close eye on this one because of recent flips in the outlooks. Additional wetness will come – but much additional would still lead to issues. (3/x)
Dennis Todey@dennistodey · Mar 1, 2020
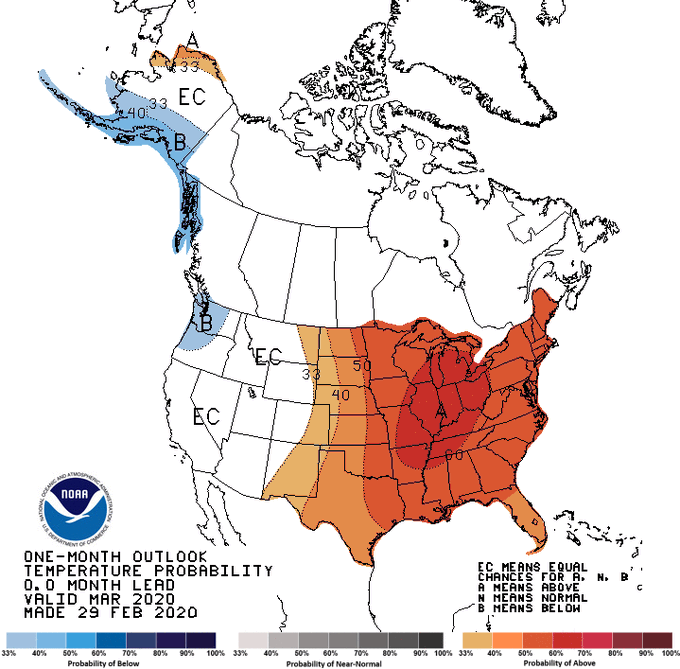
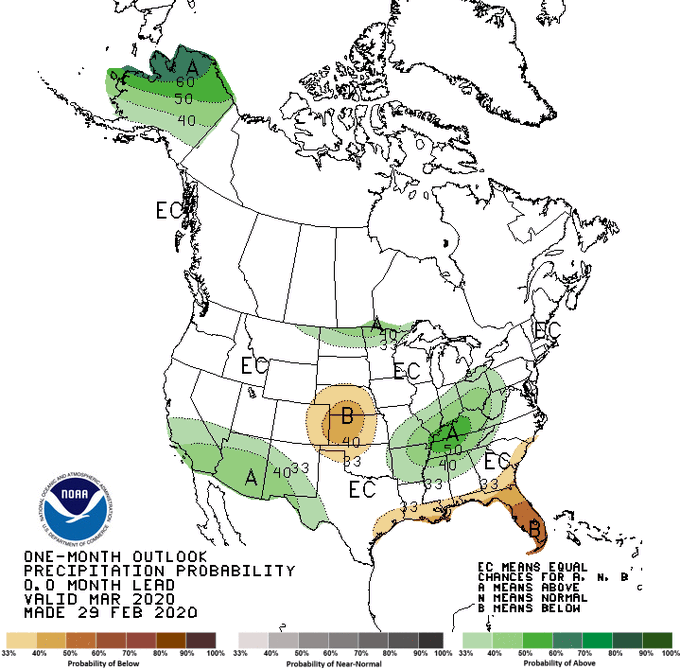
Update to yesterday’s comments with @NWSCPC March outlook. Flip to likely warmer for March – made sense given other indicators. Precip wetter Ohio Val. – drier likely c. Plains. Definite risk reduction on planting delays.
Dennis Todey@dennistodey
Soils still wet across Corn Belt. But recent dryness helping along with continued draining (tiles) through winter. Not cold recently – actually continued warm in the east.
Meanwhile, William Edwards and Mark Hanna explained in a recent Ag Decision Maker update from Iowa State University Extension (“Days Suitable for Fieldwork in Iowa“) that, “The actual number of suitable field days will vary considerably from year to year. Figure 1 [below] shows the statewide number of field days recorded each year for the period April 2 to June 17, when most tillage and planting operations are done. The number of days available varied from only 20 in 1993 to 60 in 1977. In 2019, only 26 suitable field days occurred, one of the lower numbers since 1964.

“The straight line on the graph shows the trend in the number of field days over the period 1968 through 2019. The line has a downward slope, which means that the number of field days has been decreasing over time on average. The trend line value has dropped from 48 days to 35 days since 1964, or almost one full day every four years. This means that the window for completing spring fieldwork in Iowa is shrinking significantly.”
Source: Keith Good, Farm Policy News