5 Macro-Economic Factors to Watch in 2020
In an earlier post, we outlined four key questions about COVID-19 and U.S. agriculture. A significant uncertainty noted was the U.S. economy, especially when thinking about where conditions might be in 12 to 18 months. In response to questions we’ve received since that post, this week we’ve outlined five key macro-economic factors to monitor in 2020.
#1. GDP
Gross Domestic Product (GDP) is the key measure of economic activity in the U.S. We previously noted Goldman Sachs, at least initially, projected a 24% decline in GDP for the second quarter. More recently, they have updated their expectations and now forecast a 9% contraction in the first quarter and a 34% decline in the second quarter. JPMorgan’s forecasts, which included a 40% decline for Q2, are even more pessimistic.
To provide context, figure 1 shows quarterly economic data since 1948. Note that the 3.9% contraction in 2009 (Q2) was, to date, the sharpest contraction in 70+ years. The above forecasts would, by far, be far more severe than anything observed in recent memory.
On the other side of the coin, the same Goldman Sachs report anticipated a strong recovery in the third quarter, +19%, well above anything observed in recent history. This sets the stage for a potential whiplash of economic conditions.
How will the wild ride play out across the entire year? The Goldman Sachs forecast is a 6.2% decline in GPD, levels not observed since 1946 and the 1930s. 2009, for reference, was a 2.5% contraction.
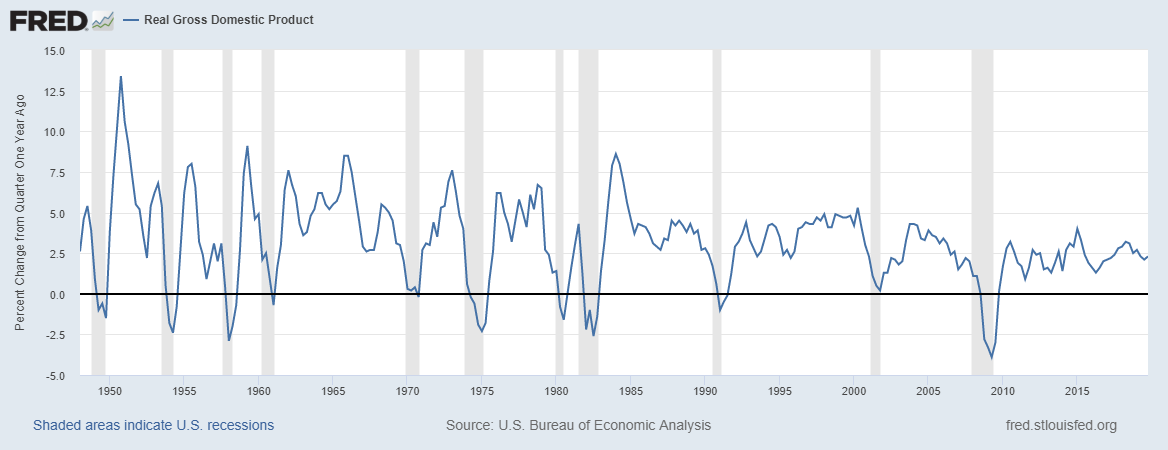
Figure 1. Real Change in Gross Domestic Product, Quarterly. Change from Quarter One Year Ago. Source: Federal Reserve Economic Data, St. Louis Federal Reserve.
#2. Interest Rates
Anticipating the economic slowdown, the Fed stepped in to provide stimulus and liquidity in debt markets. Their most visible actions were lowering the Federal Funds Target Rates on March 3 and March 15 (here and here). Figure 2 shows how those movements translated in lower rates for various maturity of Treasuries.
There are a couple of things to note. First, the Treasuries market, especially on the 10- and 30-year maturities, were quite volatile over the last 45 days. Secondly, keep in mind that there are factors beyond the Fed’s target rate that impact farm-level (or firm-level) interest rates. The FRED database also posts effective interest rates for corporations issuing bonds. The highest-rated U.S. corporations (AAA), have seen average rates fall, albeit volatile. Less secure corporations (BBB), however, have seen average borrowing costs increase significantly. This is to say that the Fed’s target rate is only one piece of the situation.
Thinking ahead, one also has to wonder how the Fed will respond if the forecasts of strong economic growth in late 2020 are realized.
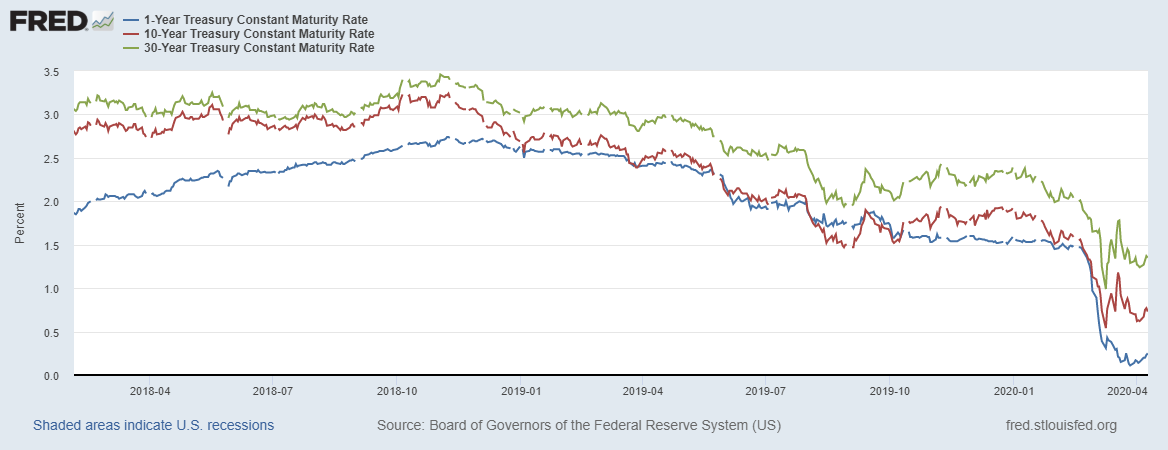
Figure 2. Interest Rates on Select Treasuries. Data Source: Federal Reserve Economic Data, St. Louis Federal Reserve.
#3. Inflation
The potential whiplash of economic activity leads us to wonder about inflation. In recent years, inflation has been historically low (Figure 3). Only once in the last decade did annual rates exceed 2.5% (3.2% in 2011). In the 1990s and 2000s, it was rare for inflation to dig below 2.5%. Looking back even further, the U.S. spent nearly a decade with inflation rates above 5% (1973 to 1982).
Again, it’s impossible to say where inflation will be a year- let alone five years- from now. It is, however, worth noting most recent conditions have been historically low.
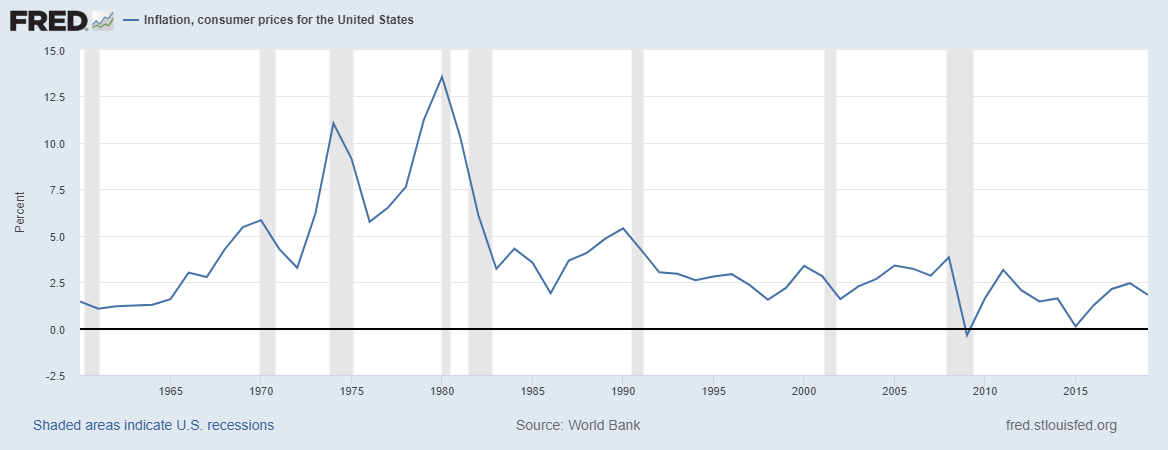
Figure 3. Inflation, Consumer Prices for the U.S. Data Source: Federal Reserve Economic Data, St. Louis Federal Reserve.
#4. Exchange Rates
Another recent shift in economic indicators has been a significant uptick in the strength (or cost) of the U.S. dollar (Figure 4). The short story here is that trade partners need to buy U.S. dollars before purchasing U.S. goods and services. For example, before international buyers can buy 1,000 bushels soybeans or corn, they need to purchase U.S. dollars. A more expensive U.S. dollar – all else the same- means the international buyer would need more local currency to buy the same quantity of product. In short, a stronger dollar will be a headwind for U.S. ag exports.
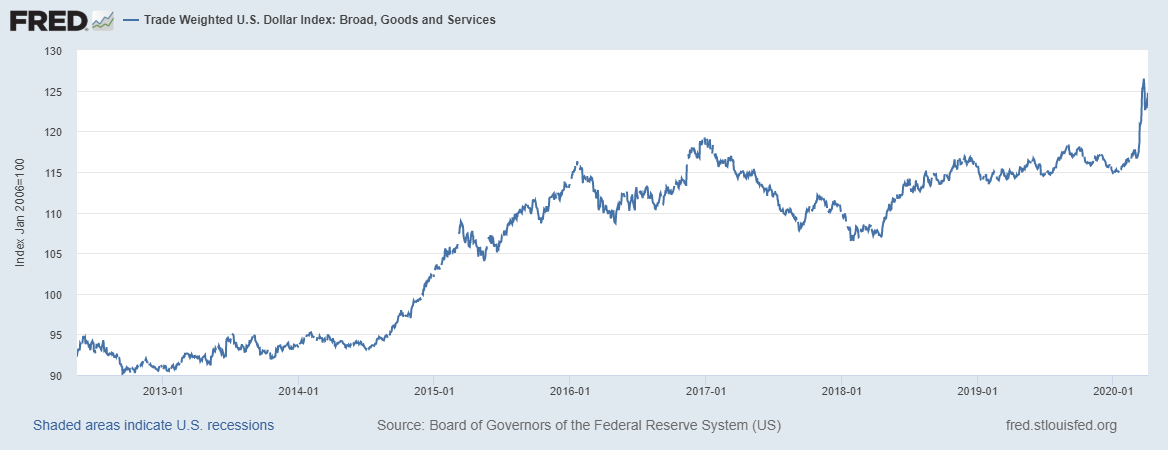
Figure 4. Trade Weighted U.S. Dollar Index. Data Source: Federal Reserve Economic Data, St. Louis Federal Reserve.
#5. Federal Deficit
Another tool for stabilizing or stimulating the economy during a slowdown is government spending – such as the recently passed $2 trillion CARES act. First of all, a trillion dollars is a lot of money. For context, the U.S. government spent $4.45 trillion in 2019. Furthermore, deficit spending – in dollars and as a share of GPD (Figure 5) – has been increasing since 2015.
For 2020, deficit spending – before COVID-19- was forecasted at nearly $1 trillion. Factoring in COVID-19 and the CARES package, the deficit may now reach $3.6 trillion.
Or course increased deficit spending and a contracting economy will make metrics like the deficit as a share of GDP (Figure 5) move sharply. Forecasts suggest the deficit might reach 10 to 13% of GDP in 2020, potentially exceeding the previous record of 9.8% (2009).
The reasons why this is important is that conversations around federal spending, government debt, and deficient spending are likely to linger for years to come. As many will remember, it proved to be politically impossible to pass a Farm Bill in 2013. Furthermore, payments made under the 2014 Farm Bill were subject to sequestration (here and here). With an even larger deficit situation on the horizon, expect the implications to impact policy for years to come.
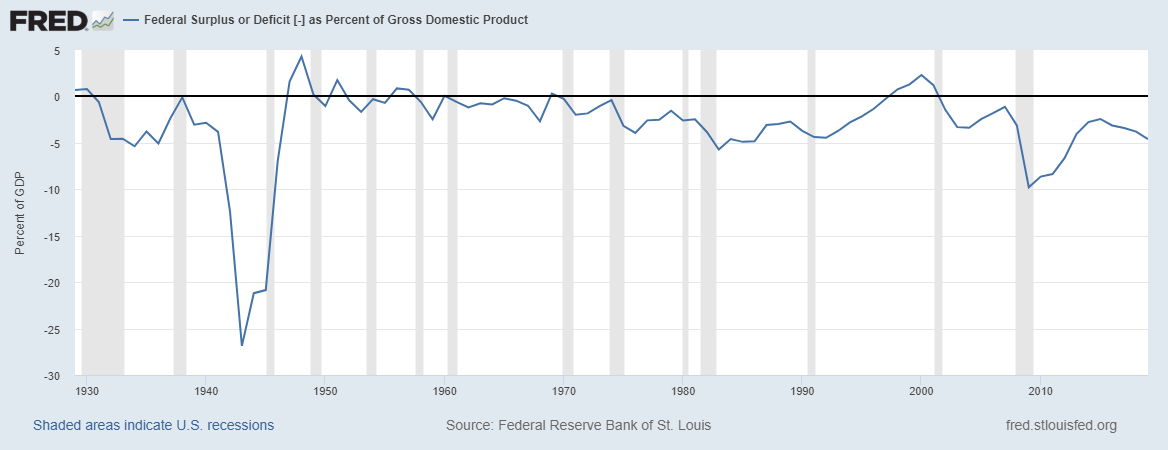
Figure 5. U.S. Federal Surplus or Deficit, as a Percent of GDP. Data Source: Federal Reserve Economic Data, St. Louis Federal Reserve.
Wrapping it up
In short, the macro-economic fallout of COVID-19 is just starting to come into focus. The only things known with certainty are 1) the economy will not revert to conditions observed just two months ago, and 2) a whiplash of extremes seems very possible. In the case of GDP, it seems possible to set records on 70+ years of data for the sharpest quarterly contraction and expansion. Furthermore, these polar-opposite records could happen in successive quarters.
Additionally, this post focused on just a few economic indicators. Unemployment, for example, is also expected to significant swing.
Macro-economic factors are largely outside of the supply and demand factors of agricultural production. That said, the macro-economy can have significant impacts on the farm economy. It’s important to remember that conditions faced in 2020, and beyond, may be very different from what’s been the case in recent memory.
Click here to subscribe to AEI’s Weekly Insights email and receive our free, in-depth articles in your inbox every Monday morning.
You can also click here to visit the archive of articles – hundreds of them – and to browse by topic. We hope you will continue the conversation with us on Twitter and Facebook.
Source: Brent Gloy and David Widmar, Agricultural Economic Insights

