2020 Acreage-Winter Wheat Bats First
With the prevented planting headaches of 2019, many noted that “Mother Nature bats last.” With the 2020 acreage debate coming into focus, it’s also worth remembering the winter wheat bats first. This week’s post reviews the USDA’s latest 2020 winter wheat acreage estimate and potential impact for corn and soybean acreage.
Winter Wheat
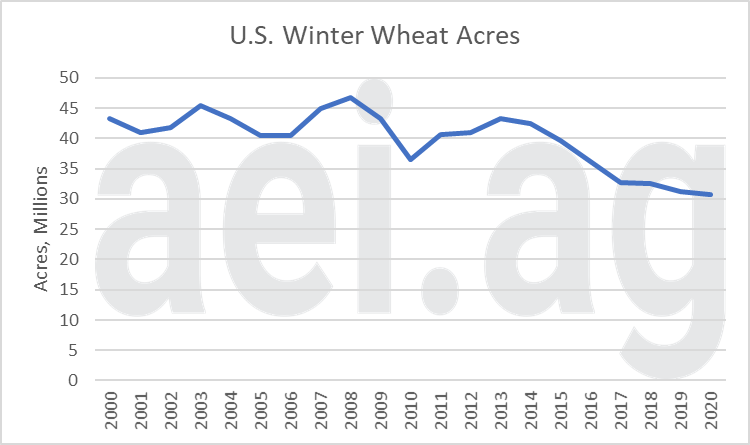
Earlier this year, the USDA estimated U.S. winter wheat acres at 30.8 million acres. This represents a modest decline in acres from 2018 levels (355,000 acres fewer) but underpins the broader trend of fewer U.S. wheat acres. Figure 1 shows U.S. winter wheat acres since 2000. Overall, winter wheat acres (and all wheat acres) have been in a downward slide. A trend-line through the data reveals winter wheat acres have declined at an average annual rate of 560,000 fewer acres each year. That rate seems small on an annual basis but certainly adds up over 20 years. These lost winter wheat acres have, of course, found their way into alternative crops –namely corn and soybeans.

Figure 1. U.S. Winter Wheat Acres, 2000 – 2020. Data Source: USDA NASS.
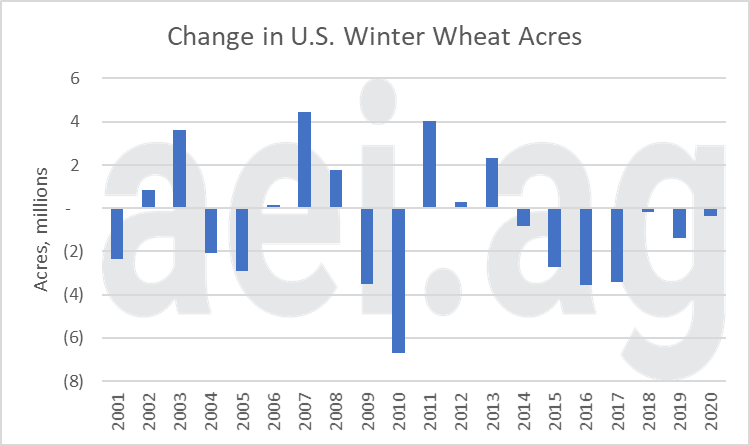
Figure 2 shows the annual change in winter wheat acres. The first thing that jumps out is that, historically, winter wheat acres have moved significantly. Since 2000, the annual change – as an absolute value- has been more than 5% in 12 years. In other words, the annual change in wheat acres has been more than 5% (higher or lower) in 12 out of the past 20 years. In that context, the change in 2020, 1% lower, is rather tame.

Figure 2. Annual Change in Winter What Acres, 2001-2020. Data Source: USDA NASS.
Wheat & The Long Run
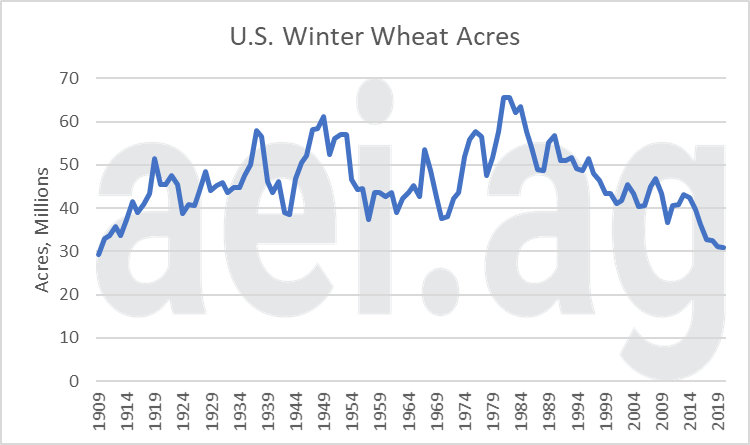
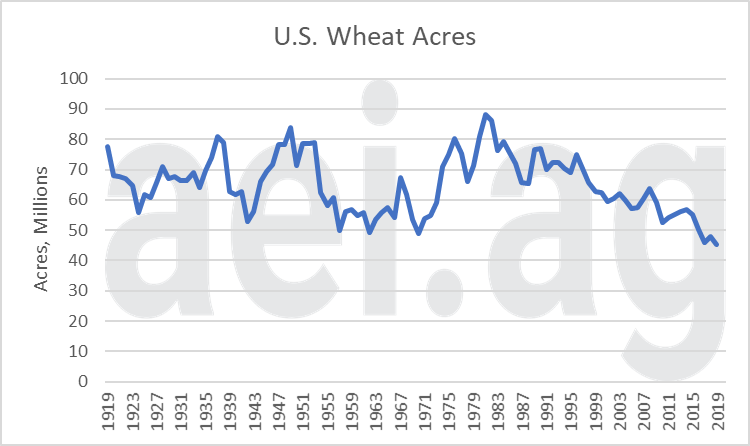
Shown in Figures 3 and 4 is the long-run story for U.S. wheat. Specifically, winter wheat acres since 1909 are shown in Figure 3. Figure 4 shows total wheat acres since 1919. In both cases, the story has been a decline since the early 1980s.
Current acreages are at historically low levels. Total wheat acres in 2019 were the lowest in 101 years of data. Winter wheat acres in 2020 will be second-lowest in 112 years; acreage was only lower in 1909.
As mentioned earlier, the trend on an annual basis can seem small. Since U.S. wheat acres peaked in 1981, a trend-line shows the average rate of decline was 858,000 fewer acres each year. The headline in this wheat story has been the stubborn duration of the trend, nearly 40 years. Another way of thinking about the trend: the pace is equivalent to losing more than a Kansas and Nebraska worth of wheat acreage each decade[1].

Figure 3. U.S. Winter Wheat Acres, 1909-2020. Data Source: USDA NASS.

Figure 4. U.S. Wheat Acres (total), 1919 – 2019. Data Source: USDA NASS.
Wrapping it Up
The decline in winter wheat acres has not occurred in a vacuum. Fewer wheat acres have occurred as additional acres of corn and soybean production.
Thinking about 2020, the winter wheat report did not pack much excitement. On the one hand, this is good news as a large decline in wheat acres – like what occurred from 2015-2017 – would have been burdensome on corn and soybean production. On the other hand, an uptick in winter wheat acres would have taken some pressure off corn and soybeans in the 2020 acreage debate. Attention will now focus on the spring crop insurance price discovery period.
Click here to subscribe to AEI’s Weekly Insights email and receive our free, in-depth articles in your inbox every Monday morning.
You can also click here to visit the archive of articles – hundreds of them – and to browse by topic. We hope you will continue the conversation with us on Twitter and Facebook.
[1] In 2019, wheat acres were 6.9 million in Kansas, 1.07 million in Nebraska.
Source: David Widmar, Agricultural Economic Insights

