Prevented Plant at Historic Highs Again in 2020
In March, the USDA’s Prospective Planting report initially sized up 2020 acreage at 97.0 million for corn and 83.5 million for soybeans. The June acreage report walked corn acreage back considerably, and most recently, the October WASDE has pegged 2020 planted acreage at 91.0 million for corn and 83.1 million for soybeans. How did this happen? In the shuffle of all the uncertainty and chaos of 2020, Mother Nature dealt another significant supply management program to corn and soybean producers. This week’s post considers the mostly overlooked 2020 prevented plant situation.
Prevented Plant Acres
Figure 1 plots total prevented plant acreage across the U.S. since 2007. Additionally, the annual total is split into three categories: corn, soybeans, and other crops.
As one would expect, 2019 stands out. With 19.6 million acres of total prevented plant reported, those levels were more than double the previous highs (9.6m in 2011, 9.4m in 2013). 2019 also stood out as recent years – 2016 to 2018 – were among the lowest years of prevented planting.
It’s surprising how the prevented plant situation in 2020 has gone mostly unnoticed. While significantly below 2019’s record-high, prevented planting in 2020 is at the second-highest level in 14 years of data. Currently, 10 million prevented plant acres have been reported, of which 6 million are of corn and 1.5 million are of soybeans.
Figure 1 also plots the series average in black (6.1 million acres). It’s worth pointing out – in this case – the average is tricky. There is a lot of variation in these data. About three years come in around average (2010, 2014, 2015), with a few years considerably above average, and several years well below average. This means we must be careful with how we think about what are “normal” prevented plant conditions.
Finally, prevented plant acreage in 2012 hit a low of 1.3 million total acres. Roughly 250,000 acres of corn were reported, along with 160,000 acres of soybeans. This highlights three key points. First, there is always some-level of prevented planting. In fact, you can count on more than a million acres to go unplanted each year. The critical question is the level of prevented planting for a given year.
Second, the range of observations (1.3 million in 2012 to 19.6 million in 2020) is wider than most might expect.
Finally, be careful when thinking about the implication of favorable planting conditions and final yields; the favorable planting conditions of 2012 are not what most of us remember about that year.

Figure 1. U.S. Prevented Plant Acres, 2007-2020. Data Source: USDA FSA. (Oct. 2020 data)
Corn and Soybeans
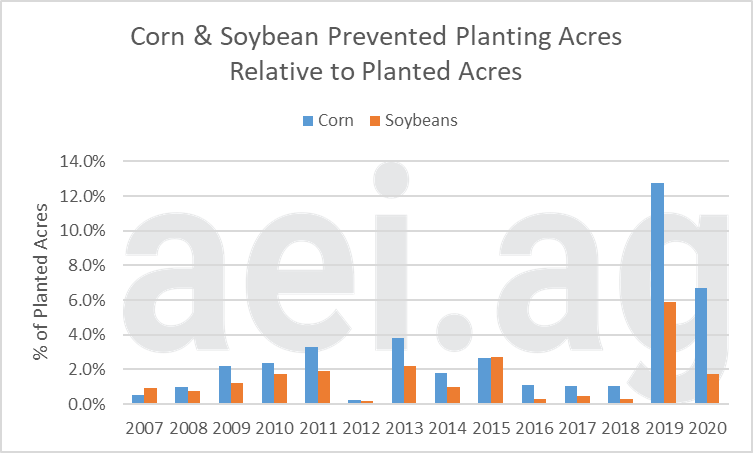
Over the last decade, corn and soybean acres have trended higher, making it tricky to think about prevented plant influence on an acre basis. Figure 2 shows corn and soybean prevented plant acres reported as a share of planted acres. For 2020, prevented planting equals 6.7% of planted corn acres and 1.8% for soybeans.
Tire tracks with rainwater in an arable field under a dark cloudy sky
This chart also reveals that prevented plant is much more common for corn than soybeans. These data don’t support the comments we frequently hear about farmers prioritizing getting their corn acres planted and finishing with whatever soybean acres they can. Only twice in fourteen years (14% of observations) have relative soybean prevented plant acres exceeded corn (2007, 2015). On average, prevented plant accounts for 2.9% of planted corn acres and 1.5% of planted soybean acres.

Figure 2. Corn and Soybean Prevented Plant Acres, Relative to Planted Acres. 2007-2020. Data Source: USDA FSA (Oct. 2020 Data) and aei.ag calculations.
Implications
In March, the USDA projected U.S. producers would plant 180.5 million acres of corn and soybeans. Currently, however, the USDA reports only 174.1 million combined acres were planted. The adjustment – a 6.4 million-acre contraction – is a 3.5% reduction. For comparison, a 3.5% change in corn yields – assuming 177 bushels per acre – is 6 bushels.
It becomes tempting to size up the influence on corn and soybean production. However, don’t lose sight of the big picture. For the second year in a row, Mother Nature has implemented an effective supply management program that limited overall corn and soybean production. The large prevented plant acreage of 2019 and 2020 has had a large influence on production. Furthermore, the reduced acreage has helped offset the reductions and uncertainties about usage. In short, prevented planting has been a big source of improvement to the corn and soybean outlook in 2020.
For some context on the magnitude, prevented plant in 2019 and 2020 has been 29.8 million acres. That is roughly the same as the total prevented plan acreage of the preceding six years (2013-2018).
Finally, similar to ad hoc government programs, producers – and the market – can’t plan on another year of “good luck” from prevented plant acreage. At some point, we can expect below-average prevented plant outcomes, which will have a burdensome effect on the balance sheets.
Wrapping it Up
Prevented plant in 2020 appears to be another case of “the starting point matters.” This year’s prevented plant situation is mostly in the shadow of 2019’s record-shattering level but stands as the second-highest prevented plant acreage in 14 years of data.
That said, it’s critical to recognize the current outlook for corn and soybeans has benefited from back-to-back low-probability outcomes in terms of planting conditions. At some point, conditions will return to something more “normal,” if not historic lows, and cause challenges.
Click here to subscribe to AEI’s Weekly Insights email and receive our free, in-depth articles in your inbox every Monday morning.
Looking for more? AEI Premium provides even more insights and content. It is also where you can challenge your thinking with the Ag Forecast Network (AFN) tool. Start your risk-free trial here.
Source: Agricultural Economic Insights

