2020 Net Farm Income-Early Forecasts Higher
The USDA released it’s first – and early- forecast of net farm income for 2020. Farm income is an important – but not complete- measure of the health farm economy. While the headlines are positive, we took a more in-depth look at the estimates in this week’s post.
Net Farm Income
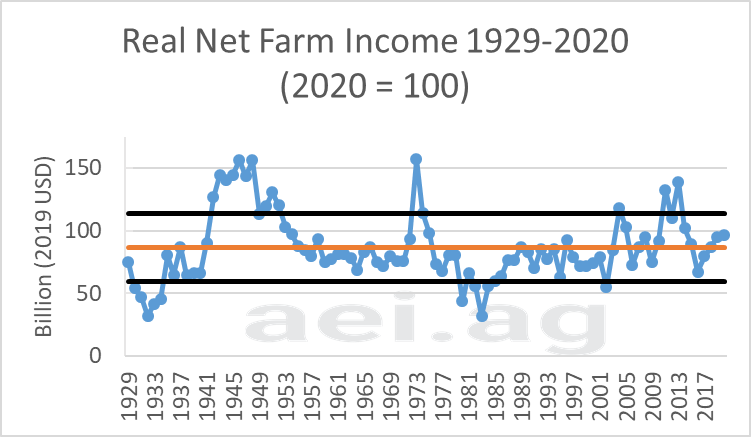
Figure 1 shows real, or inflation-adjusted, net farm income since 1929. Plotted in orange is the average for these data over the 92 years ($86.5 billion). Additionally, the black lines represent one standard deviation ($27 billion) above and below the mean.
The forecast for 2020 is sector-wide income of $96.7 billion. Overall, the 2020 forecast is slightly improved over 2019, $1.4 billion higher (+1%). Farm incomes in 2020 are also expected to be $10 billion higher than in 2018, or 11% higher over the two years. To date, the farm economy hit its low point in 2016, when sector income was $67 billion. Overall, farm income has steadily increased over the last five years.
Farm incomes in 2019 and 2020 are also considerably above the long-run average of nearly $87 billion. Both of these observations- farm incomes above the long-run and trending higher- are positive signs for the farm economy.
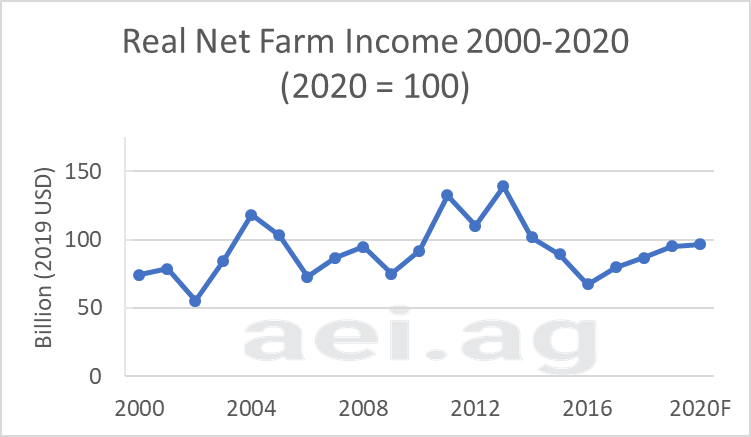
For a slightly different perspective, figure 2 shows real farm incomes between 2000 and 2020. These are the same data as in figure 1, just fewer years presented. The graph shows more clearly how high incomes of $97 billion in 2020 would be. To that point, the current 2020 forecast would be the 7th highest observation in 21 years of data.

Figure 1. Real U.S. Net Farm Income, 1929-2020 (2020=100). Data Source: USDA NASS (Feb. 2020).

Figure 2. Real U.S. Net Farm Income, 2000- 2020 (2020=100). Data Source: USDA ERS (Feb. 2020).
Digging into the Details
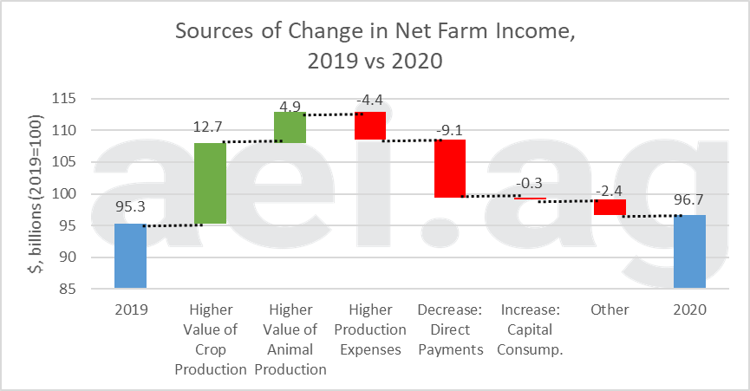
The 2020 income estimate is a bit of a headscratcher, especially given the magnitude of MFP payments in recent years, and the USDA’s adamant position there would be no MFP payments for 2020 production. This nudged me to dig into the sources of change between 2019 and 2020. Figure 3 summarizes this into six categories.
While the overall forecast for 2020 is a slight change from 2019, there is a lot of activity within the categories. On the positive side of the ledger, the USDA is forecasting a significant increase in the value of crop and livestock production in 2020. The increase in these two categories represents a $17.6 billion boost. More on that later.
The two most substantial headwinds in 2020 are higher costs of production ($4.4 billion) and fewer direct payments ($9.1 billion). Even with the significant decline, 2020 estimates of direct payments still include $3.6 billion in MFP payment from 2019 production (paid in 2020).
Finally, the “other” category includes an estimated $3.4 billion decline in crop insurance proceeds.

Figure 3. Source of Change in Net Farm Income between 2019 and 2020. Data Source: USDA ERS (Feb. 2020).
Higher Value Production
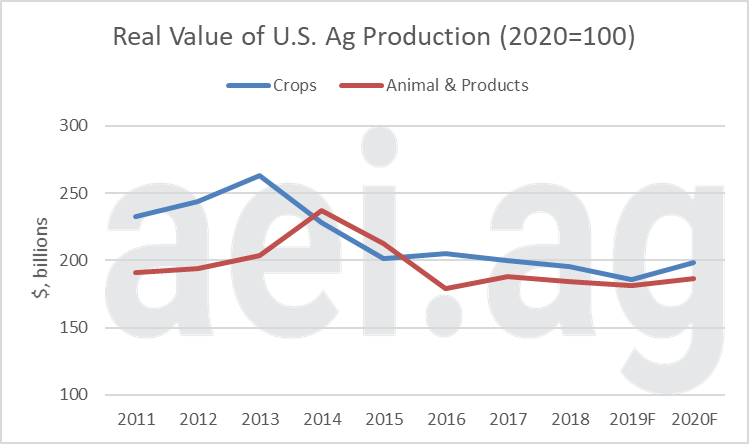
An important driver in forecasted 2020 conditions was the seemingly large increase in the value of crop and livestock production. Figure 4 shows the real (inflation-adjusted) value of U.S. ag production for crop and animal (2020=100). As expected, the value of ag production declined after 2013/2014 but has stabilized in recent years. In 2019, the value of crop and livestock production retracted; 5% lower for crops, 1.5% lower for livestock.
The uptick observed in figure 3, however, is mostly a return to the status-quo (again, measured in inflation-adjusted terms). That said, it is also worth noting the value of production in 2020 is also forecasted to be the highest level observed since 2017.
Keep in mind that the value of production is impacted by both quantity produced and prices received. In 2019, below-trend yields and significant prevent planting were both adversely impacting this measure for crops.

Figure 4. Real Value of U.S. Ag Production, Crop (in blue) and Animal & Products (red), 2011-2020F. 2020=100. Data Source: USDA’s ERS (Feb. 2020).
Wrapping it Up
While the USDA’s top-line number for 2020 net farm income shows a small increase over 2019, there are several moving pieces. The USDA’s forecast includes the expectation of higher value of production offsetting a decline in direct government payments (MFP) and higher cost of production.
That said, these estimates are early and will face several rounds of updates and revisions. In fact, a significant revision to last year’s estimates (2019) will likely come in August 2020. Furthermore, numerous production and marketing uncertainties remain for 2020. All that said, this early measure is still helpful and important.
Looking ahead, it seems the most uncertainty in these estimates is centered around where the value of crop and livestock production will land in 2020. Mother nature, trade, and a host of other factors will be at play here.
We have previously noted concerns about the farm sector extend beyond income. Next week we’ll consider the USDA’s 2020 estimates for debt levels and working capital.
Click here to subscribe to AEI’s Weekly Insights email and receive our free, in-depth articles in your inbox every Monday morning.
You can also click here to visit the archive of articles – hundreds of them – and to browse by topic. We hope you will continue the conversation with us on Twitter and Facebook.
Source: David Widmar, Agricultural Economic Insights

