Disaster Avoided? Reviewing the 2019 Grain Ending Stocks Situation
Grain markets in 2019 had a familiar feel – a late June rally that faded as concerns about the U.S. corn and soybean crops subsided (see futures prices for corn here, soybeans here). This was especially frustrating for producers hoping for a substantial price improvement after spring planting challenges and record prevented planting acreage. Given Mother Nature’s best efforts to implement a supply management plan, it’s worth stepping back and considering how much grain outlook conditions changes in 2019. This week’s post reviews how projections of grain production and ending stocks changed throughout 2019.
Corn
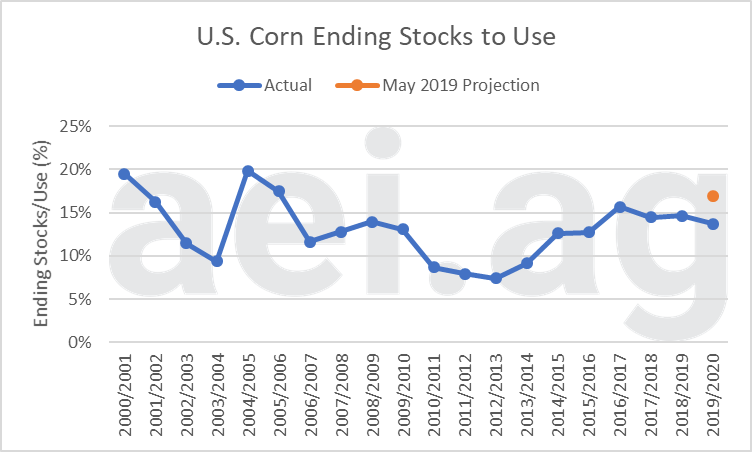
Figure 1 shows the U.S. corn ending stocks to use ratio since 2000. Additionally, the graph includes the projection from the USDA’s May WASDE Outlook (in orange). The May WASDE represents the early spring forecast – before the widespread planting challenges were evident.
Currently, U.S. corn ending stocks are 13.7% of usage. While stocks are projected to be the lowest in four years, they remain above the 20-year average (13.1%). Furthermore, they remain above the sub-10% level observed when corn prices soared. While the corn stock situation has improved in recent years, conditions remain on the high side.
Stepping back a bit, keep in mind that the USDA’s May projection was much bleaker. With corn stocks to use ratio at nearly 17%, corn stocks had a very real possibility of turning higher in 2019, especially if yields came in above-trend. Additionally, the spring outlook was for corn stocks at the 4th highest level in 20 years.
For a longer-term look at grain stocks, see our earlier post.

Figure 1. U.S. Corn Ending Stocks to Use, 2000/2001 to 2019/2020. Includes May 2019 Projection for 2019/2020 (in orange). Data Source: USDA PSD (Nov 2019).
Soybeans
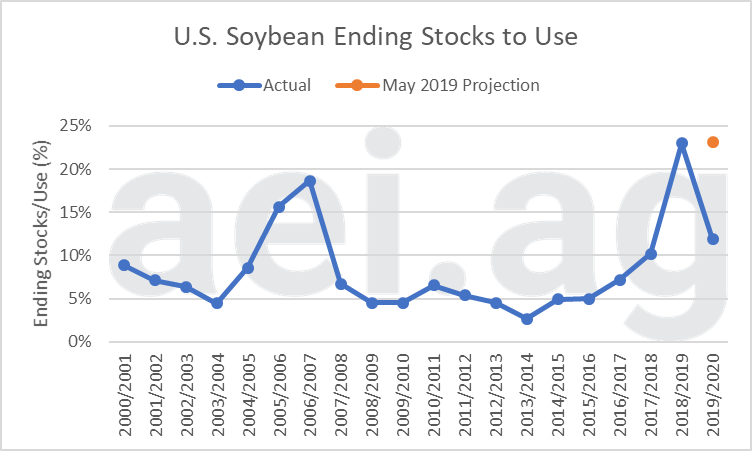
While the story for soybeans is similar to that of corn, the magnitude is much more dramatic (Figure 2). In May, the USDA projected soybean ending stocks would exceed 23% of use, the highest level in 20 years, and slightly above 2018 levels.
Currently, the soybean outlook for 2019/2020 is an ending stocks to use ratio of 11.9%. This is the result of a dramatic reduction in expected acreage – thanks to Mother Nature. While current levels remain above the 20-year average (8.3%), the adjustment has been significant and was hard to imagine just six months ago.

Figure 2. U.S. Soybean Ending Stocks to Use, 2000/2001 to 2019/2020. Includes May 2019 Projection for 2019/2020 (in orange). Data Source: USDA PSD (Nov 2019).
Wheat
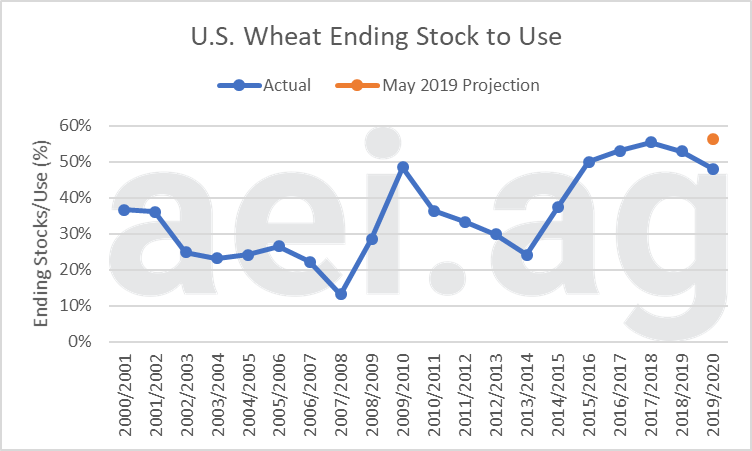
Figure 3 shows the same data for wheat. Wheat has not captured as much attention as corn and soybeans but has had a similar story. In May, the USDA had projected U.S. 2019/2020 wheat stock would be at the highest level observed over the past 20 years, 56% of usage. Currently, the outlook is much improved at 48% stock to use ratio. That said, current levels are above the 20-year average for ratio of 35%.

Figure 3. U.S. Corn Ending Stocks to Use, 2000/2001 to 2019/2020. Includes May 2019 Projection for 2019/2020 (in orange). Data Source: USDA PSD (Nov 2019).
Acres vs. Yield
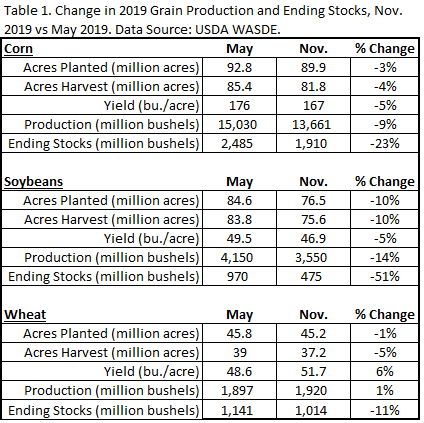
Table 1 shows the change in key 2019 grain production and ending stock figures from the November and May WASDE report. You can see how acreage, yield, production, and ending stock projections change over the seven months. We will point out a few key observations.
First, mother nature hit soybean production the hardest in 2019. Between May and November, estimated production was reduced by 14%, and ending stocks fell by 51%. Corn production estimates fell 9% while ending stocks contracted 23%. U.S. wheat production actually increased by 1% while ending stocks fell 11%.
Not included in this table are other key factors, including usage and beginning stocks.
While not shown directly in Table 1, it is worth pausing to consider which had a more significant impact on production in 2019 – the acreage hit or yield hit? For corn, the decline in yields accounted for 56% of the reduction in estimated production. Acreage accounted for 46%. For soybeans, acreage (67%) accounted for a majority of the decline in production (yields 36%).

Wrapping it Up
While record prevented planting acreage and below-trend yields failed to move prices as high as many hoped, commodity prices, alone, do not tell the entire story. Current conditions are significantly different from those projected back in May. While production declines were most significant for soybeans, production and ending stock adjustments also occurred in corn and wheat as well.
It is important to keep in mind that 2019’s production hiccups occurred when ending stocks were already high; the starting point matters. The balance sheets for corn, soybeans, and wheat improved, but the ending stock improvements were from ‘very high’ to ‘high’ levels.
While most were hoping for a significant improvement in the farm economy and commodity prices, 2019 is likely a year where the “good news” is that a potential price disaster was avoided. It is a bit sobering to consider how low commodity prices might be today had May projections became a reality. Moreover, what if 2019 was another year of above-trend yields?
Click here to subscribe to AEI’s Weekly Insights and receive our free, in-depth articles in your inbox every Monday morning.
But wait, there’s more: click here to visit the archive of our articles – hundreds of them – and to browse by topic. We hope you will continue the conversation with us on Twitter and Facebook.
Source: David Widmar, Agricultural Economic Insights

