Farm-Level Implication of MFP Payments
After the USDA and White House announced the 2019 MFP program, we noted that direct government payments were set to soar in 2019. The USDA’s most recent estimate is for $19.5 billion in total direct farm payments is more than $5.5 billion higher than 2018. For context, the USDA’s initial estimated 2019 direct payments $2.5 billion below 2018 levels. This week’s post is an updated look at direct payment trends and farm-level implications.
Direct Payments
Figure 1 shows real, or inflation-adjusted, direct farm payments since 1933 (2019=100). As many would expect, 2019’s current estimate of $19 billion is well above recent levels. Specifically, over the previous decade (2009 – 2018) real direct payments averaged $12.7 billion, and never exceeded $15 billion.
While $19 billion is high for recent memory, inflation-adjusted direct payments have exceeded $20 billion multiple times in history. In fact, direct payments exceeded $30 billion as recently as 2005.
Don’t be surprised to hear total direct payments in 2019 exceed $20 billion before the years is over. The current 2019 estimate includes the first tranche of MFP payments, but the USDA has all but promised another round of payments made in 2019. Those second-round 2019 payments total will be in addition to current MFP and direct payment estimates.
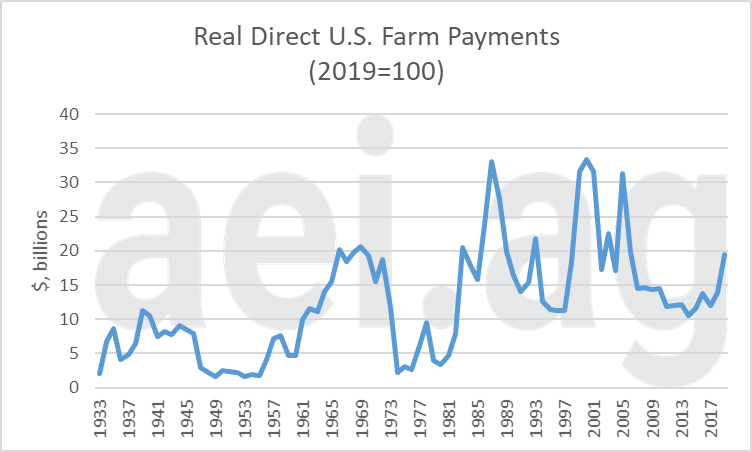
Figure 1. Real U.S. Direct Farm Payments, 1933-2019F (2019=100). Data Source: USDA’s ERS (August 2019).
Another consideration is how large direct payments are relative to net farm income. Figure 2 shows these data since 1933. When farm incomes were recently high, direct payments equaling 10% of net farm income. As farm income fell, direct payments played a more significant role. The current USDA data indicates direct payments will equal 22% of net farm income. Similar to the trends in Figure 1, current levels are high for recent memory but are not record-breaking. In the late 1990s and early 2000s, direct payments frequently exceeded 30% of net farm income. During the Farm Financial Crisis of the 1980s, direct payments reached 65% of net farm income in 1983.
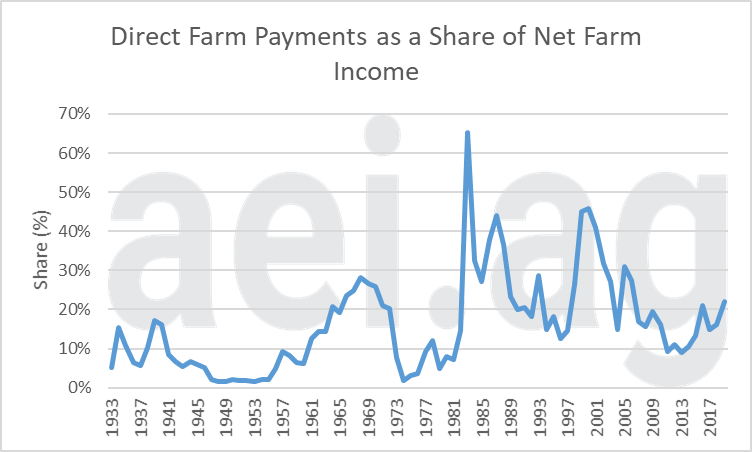
Figure 2. Direct Farm Payments as a Share of Net Farm Income, 1933- 2019. Data Source: USDA ERS.
Source of Direct Payments
There are multiple sources of direct payments. Figures 3 and 4 consider direct payments across various categories.
Figure 3 breaks spending down into eight categories (the USDA has more than 20 categories reported). The first observation is that there is a consistent baseline of conservation spending at around $4 billion annually. Between 2010 and 2018, spending on conservation accounted for 32% of total direct payments.
The second observation has been the transition from fixed direct payments to the ARC/PLC program under the 2014 Farm Bill (and continued in the 2018 Farm Bill). Fixed direct payments from 2010-2013 were an average of $5.3 billion annually. In total, the ARC and PLC programs have paid a similar amount of money. Between 2015 and 2019, the average annual payments have been $5.4 billion. Of course, the current program has been lumpy in making payments. ARC and PLC paid a total of $8.5 billion in 2015 (the high) but will only pay $2.3 billion in 2019 (the low).
Finally, notice how MFP payments have largely dominated mainly in 2018 and 2019.
Figure 4 shows the same data but in a different format. Specifically, the categories represented the percentage of total spending for each year. This chart makes it a bit clearer that 2018 and 2019 MFP payment account for 55% of current estimated direct payments. As mentioned earlier, 2019 MFP payment will likely go higher before 2019 is closed out.
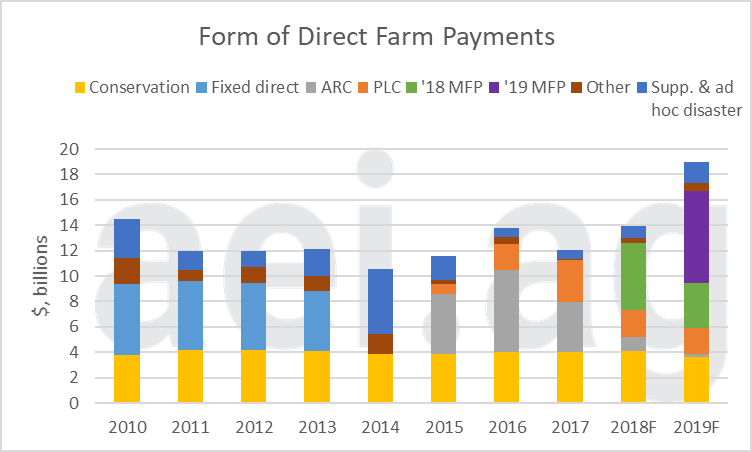
Figure 3. Breakdown of Real Direct Farm Payments, 2010-2019. (2019=100). Data Source: USDA ERS.
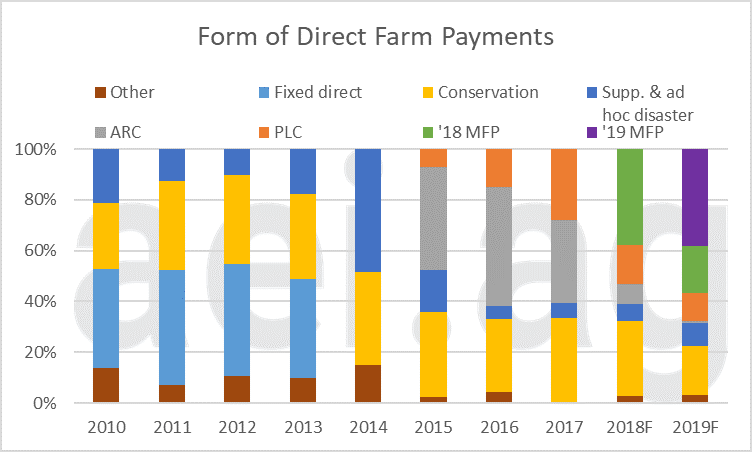
Figure 4. Share of Direct Farm Payments, 2010- 2019. Data Source: USDA ERS.
Farm-Level Implications
Figure 4 uses data from the Kansas Farm Management Association to consider the farm-level conditions of direct government payments. From 2004 and 2018, the graph shows the annual value of farm production (in blue) and government payments[1] (in orange). Prior to 2018, government payments equaled around 5% of the total value of farm production. In 2018, however, government payments -driven largely by that year’s MFP program – jumped to 9%. Keep in mind that a portion of the 2018 MFP payments were made in early 2019. This sets the stage for government payments to be an even larger share in 2019.
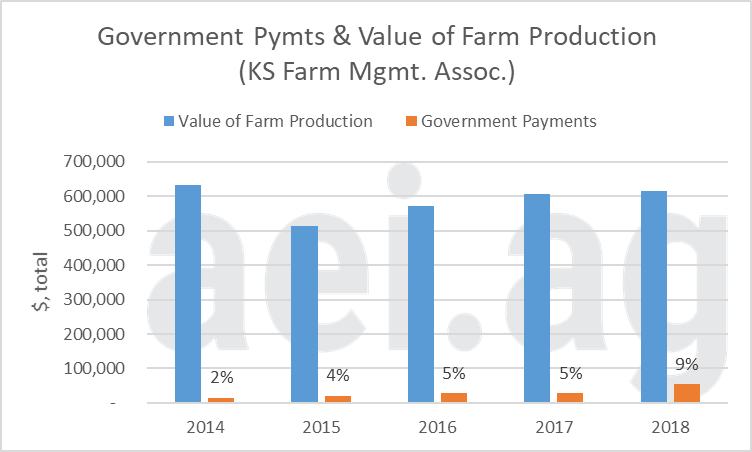
Figure 5. Government Payments and the Value of Farm Production, 2014- 2018. Data Source: Kansas Farm Management Association.
Figure 5 shows the same government payment data in Kansas, but now relative to net farm income. While farm income has trended higher from the lows of 2015, government payments stayed mostly flat until the 2018 increase. In 2016 and 2017, the average farm in the benchmark had roughly 28,000 in government payments. In 2018, government payments nearly doubled to reach an average of $54,700. The increase in government payments ($26,467) was almost 80% of the increase in net farm income between 2017 and 2018.
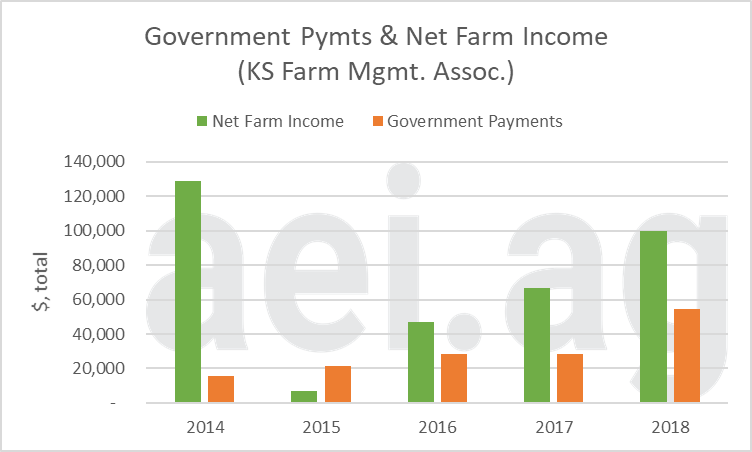
Figure 6. Government Payments and Net Farm Income, 2014- 2018. Data Source: Kansas Farm Management Association.
Wrapping it Up
We have discussed in previous posts that net farm income in 2018 and 2019 should be denoted with an asterisk. While income has trended higher, the improvement was accompanied by an uptick in direct farm payments due to 2018 and 2019 MFP payments. In 2019, at least 55% of total direct payments will come from MFP.
One understated aspect of MFP has been the unconventional nature of the program. Not only has the program been ad hoc from year-to-year (a year ago the USDA said producer shouldn’t expect a 2019 program), but also ad hoc within a year concerning round of payments. While producers have already received some payments for 2019 production, many unknowns remain about the second 50% of potential 2019 MFP payments.
When thinking about 2020, producers face a difficult budgeting situation. First, they have uncertainty about the remaining 2019 MFP payments. This can have a big impact on cash flow and working capital as they wrap-up 2019 and begin 2020. Second, producers will likely have to plan and budget 2020 as if no MFP payments were coming. That said, they mostly expect a third year of MFP. When asked in October, the Purdue/CME Group Farm Economy Barometer found 62% of producers expected a MFP-like program in 2020.
Finally, producers should carefully review how government payments have impacted their operation, especially MFP payments. In the data from Kansas farms, the MFP program pushed total government payments from 5% to 9% of the value of production in 2018. Furthermore, the roughly doubling of government payments accounted for 80% of the increase in farm income between 2017 and 2018.
Click here to subscribe to AEI’s Weekly Insights and receive our free, in-depth articles in your inbox every Monday morning.
But wait, there’s more: click here to visit the archive of our articles – hundreds of them – and to browse by topic. We hope you will continue the conversation with us on Twitter and Facebook.
[1] Similar to the data in Figures 1, 2, 3, and 4, these do not include crop insurance proceeding.
Source: David Widmar, Agricultural Economic Insights

